Theewaterskloof is up 3.3 pts on last week. Healthier than April 2019 (46%) — but below April 2025 (61%).
2018 was this close to empty.
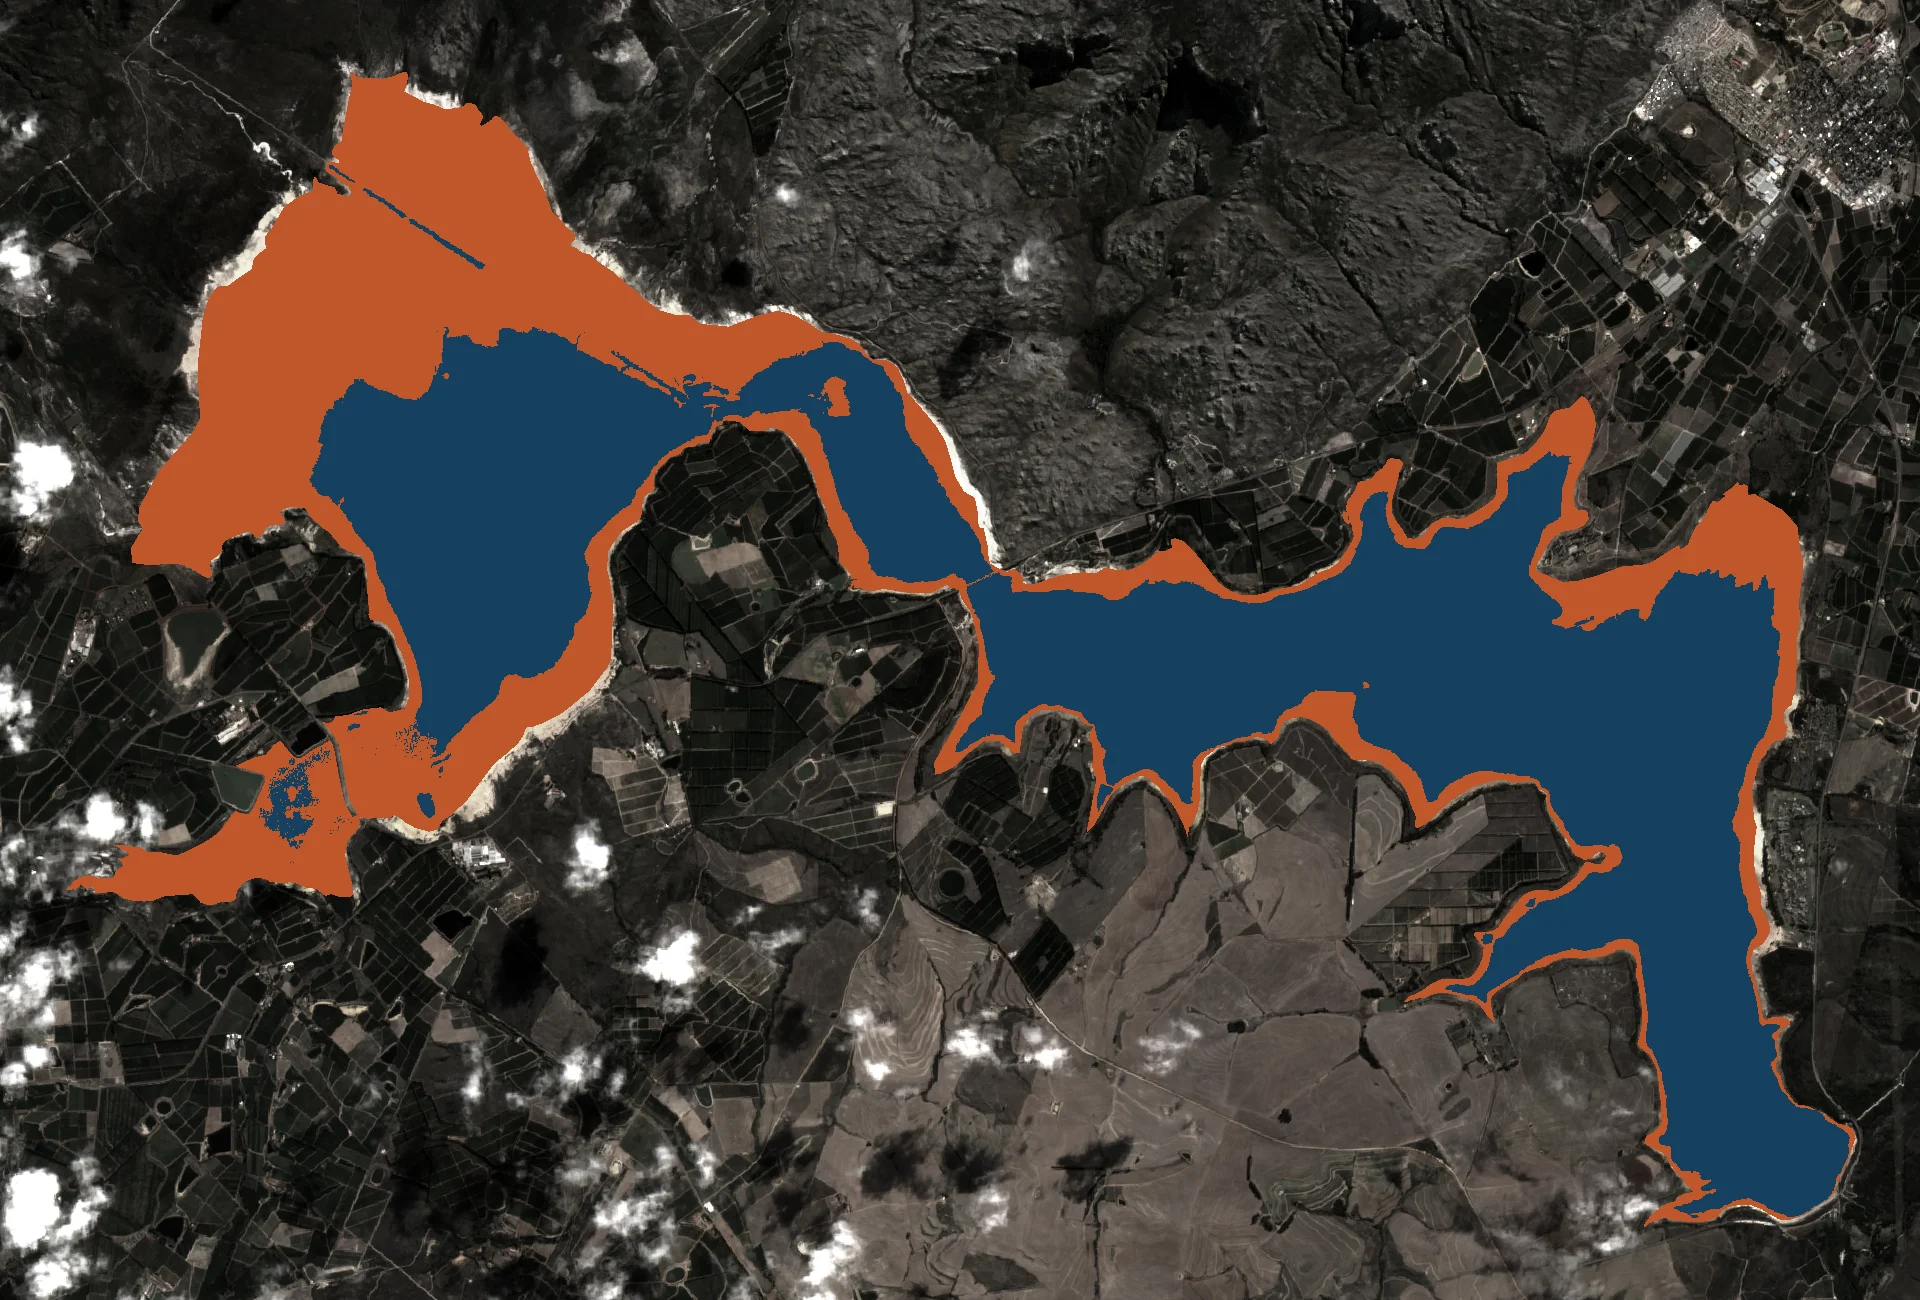
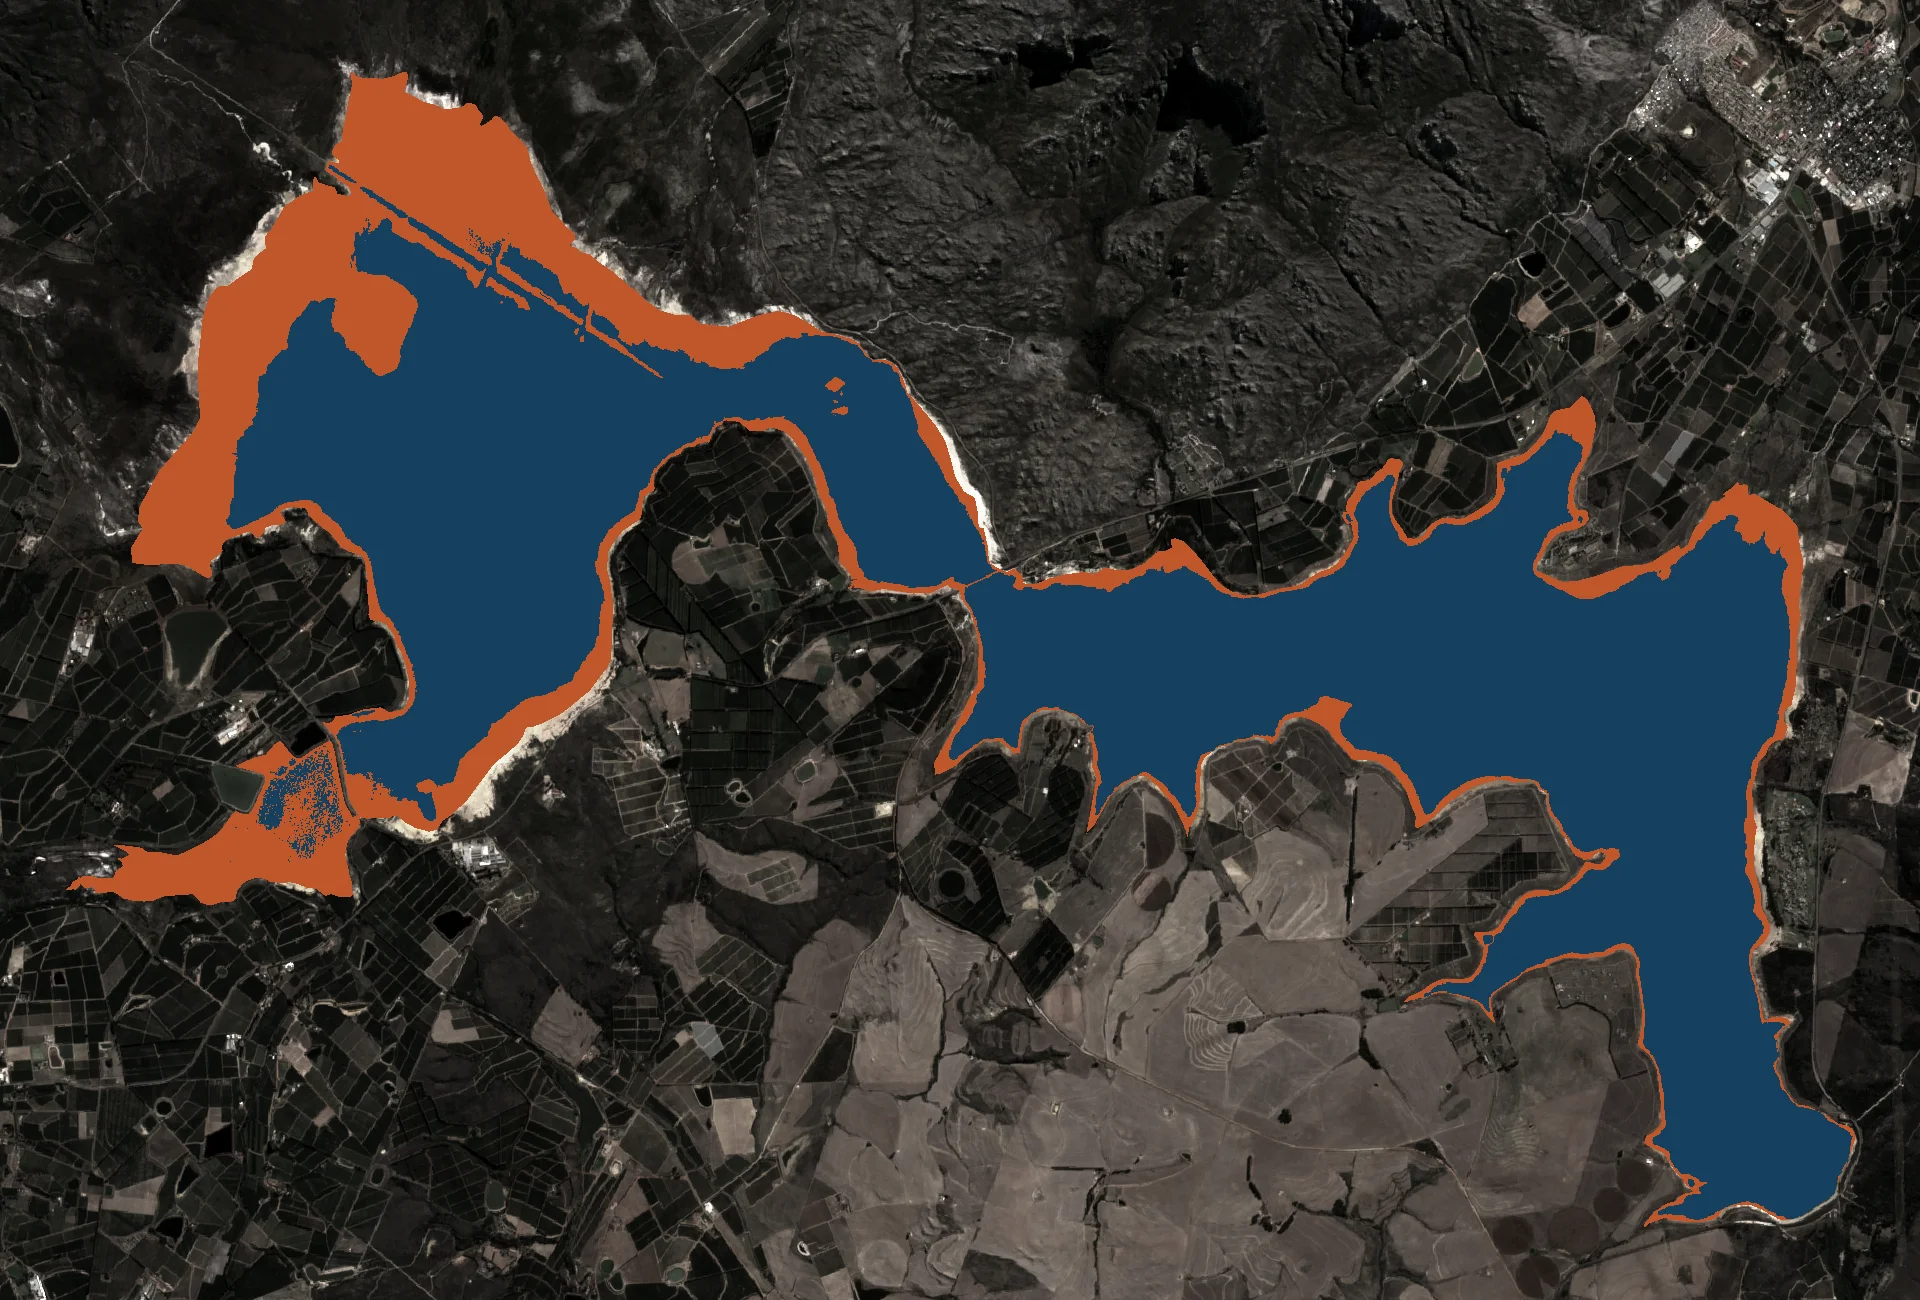
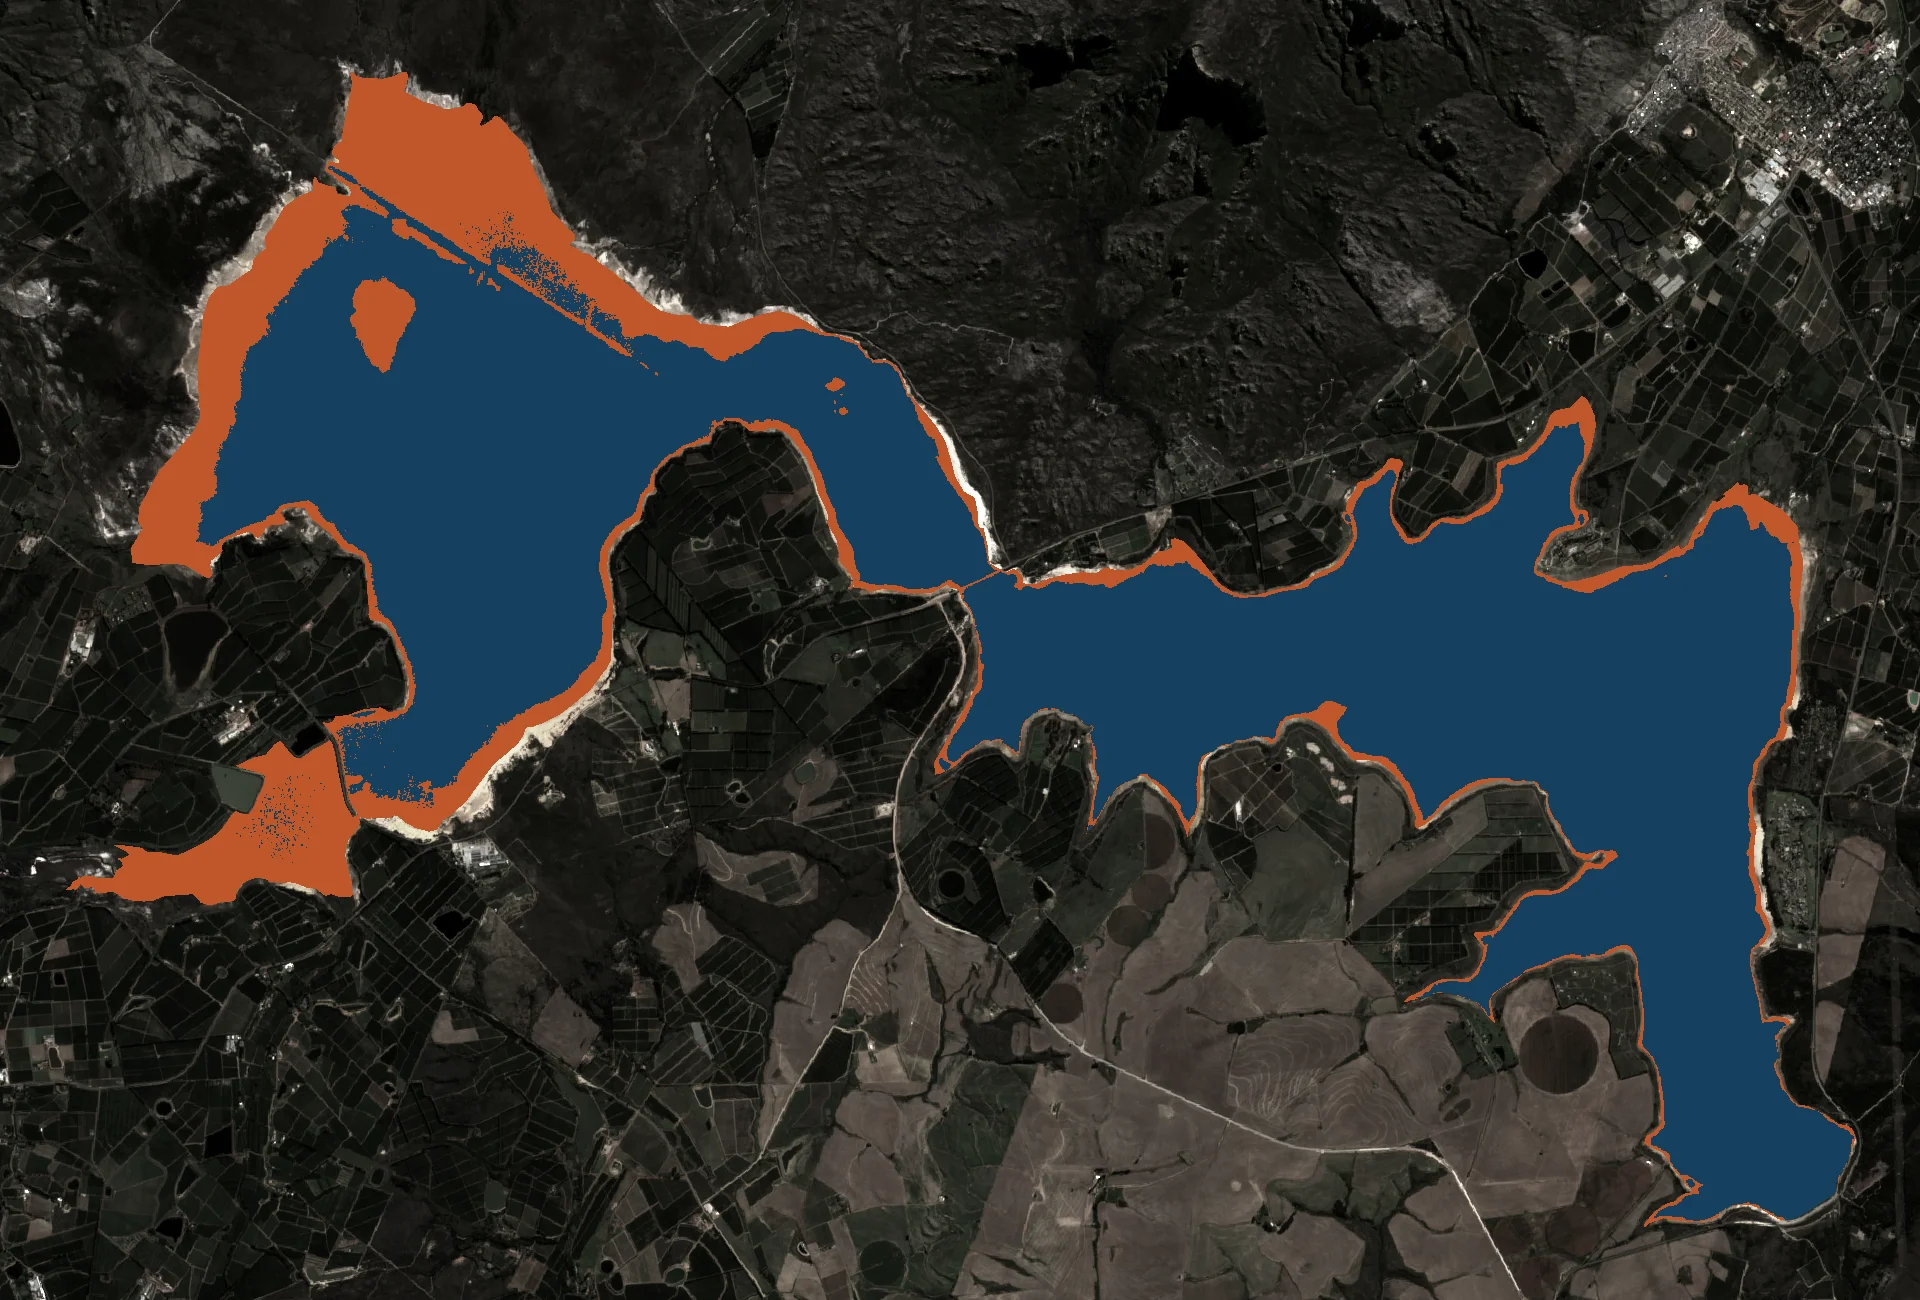
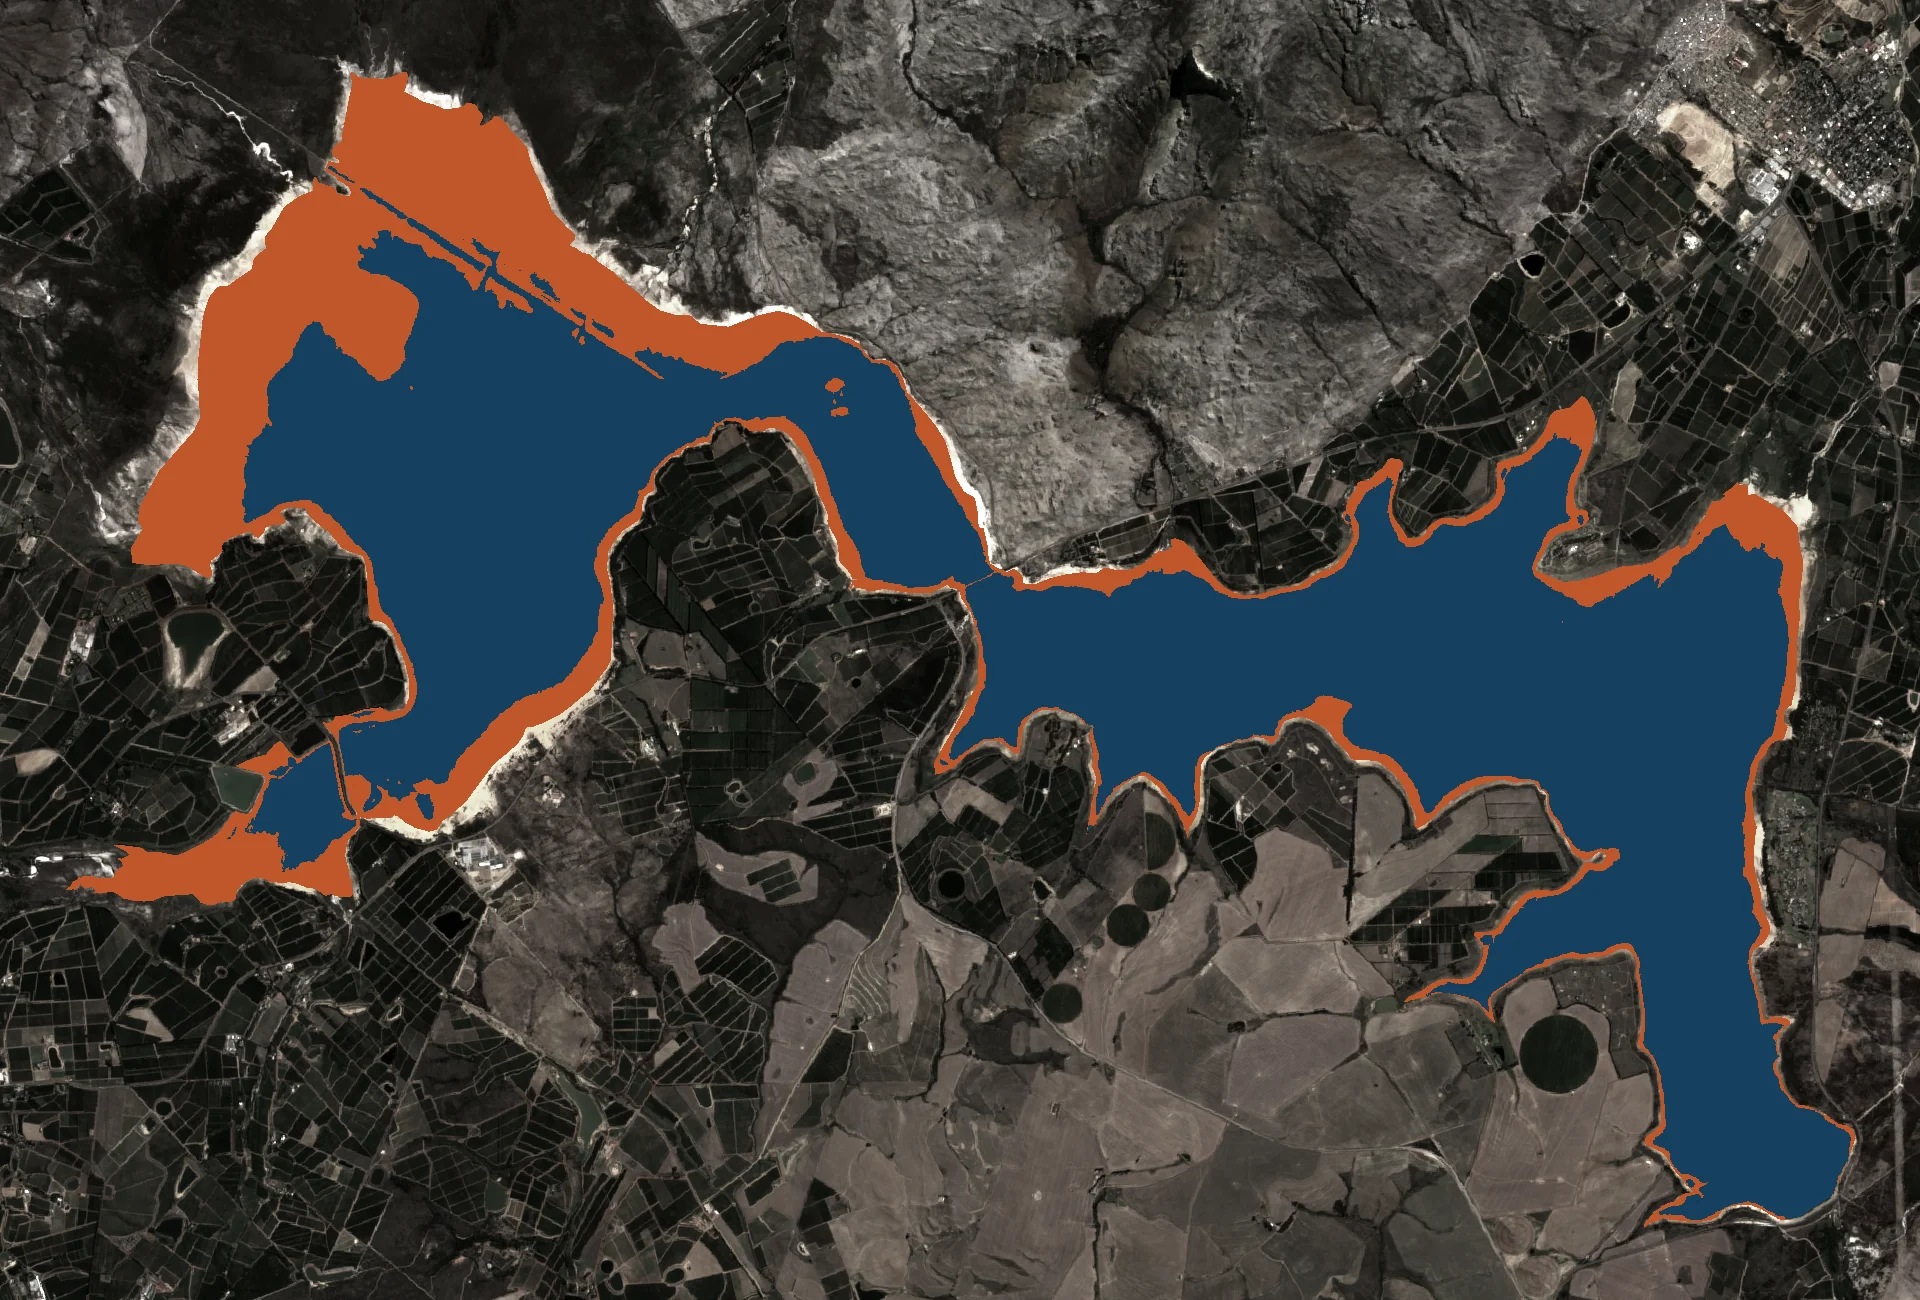
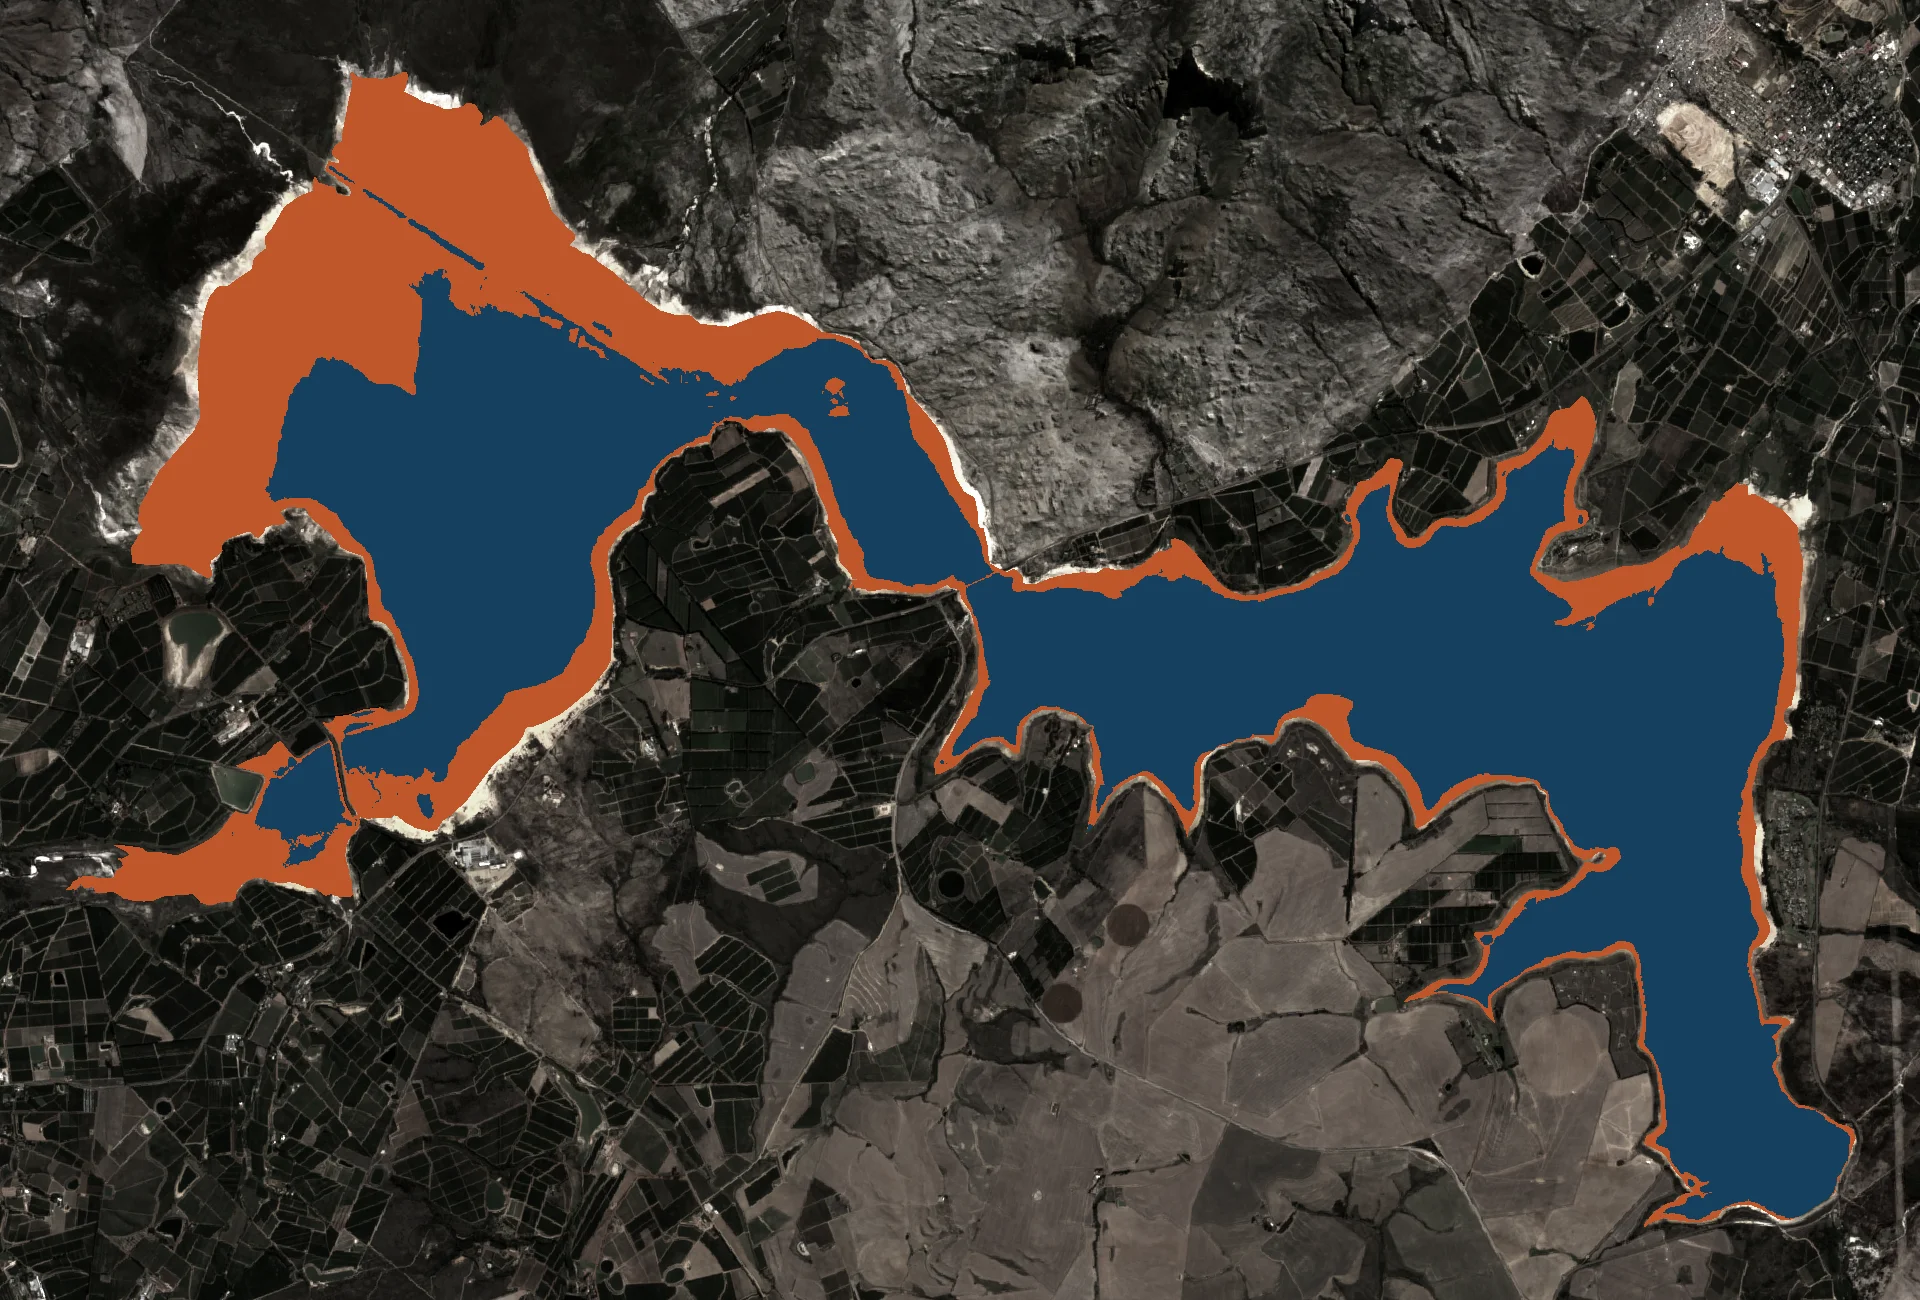
On the left: Theewaterskloof in May 2018 — the trough of the Day Zero crisis, when the dam was a chalky scar of exposed lakebed. On the right: the most recent Sentinel-2 pass. Drag the handle.
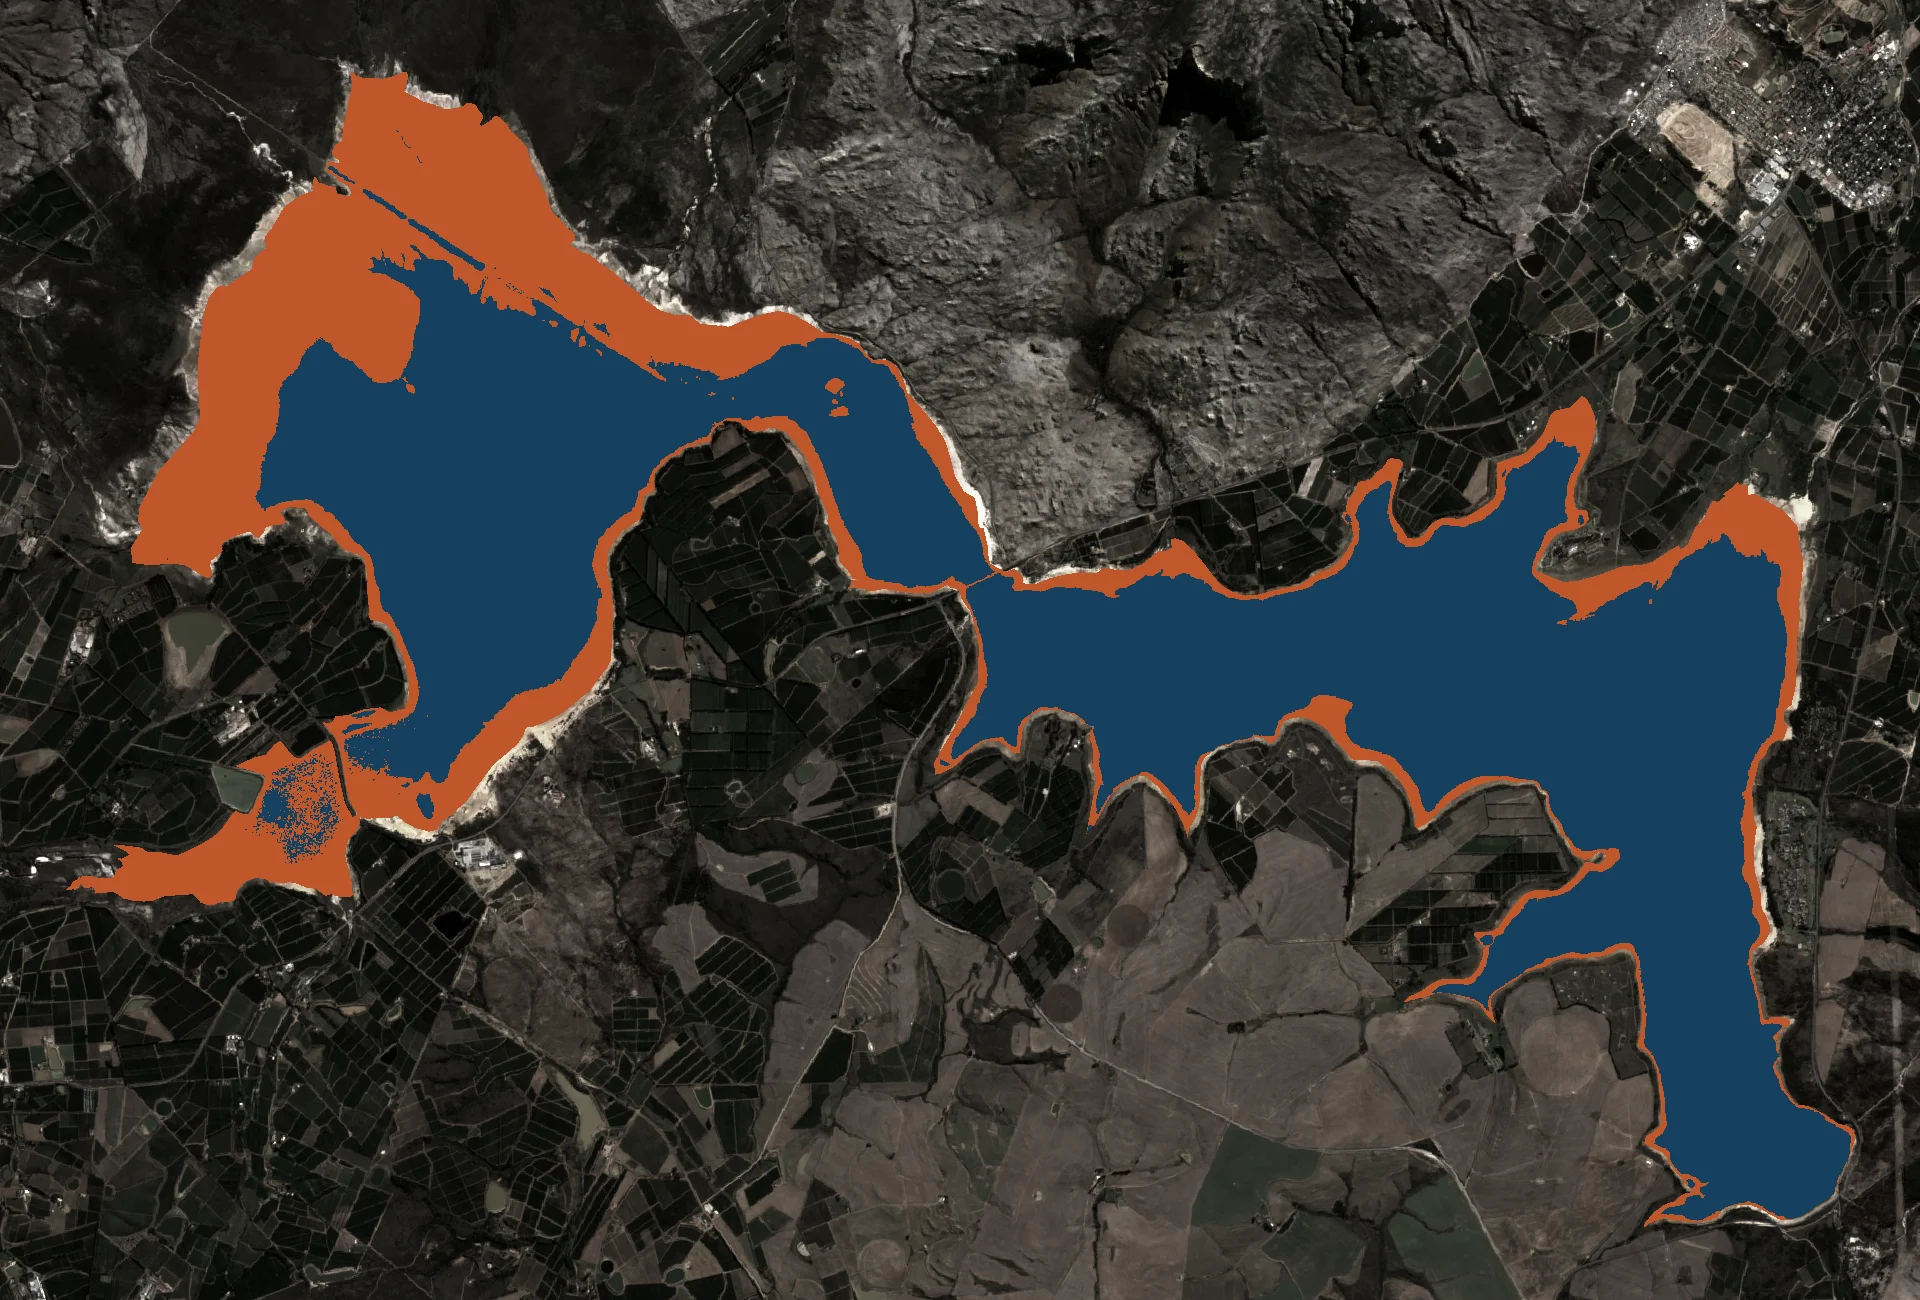
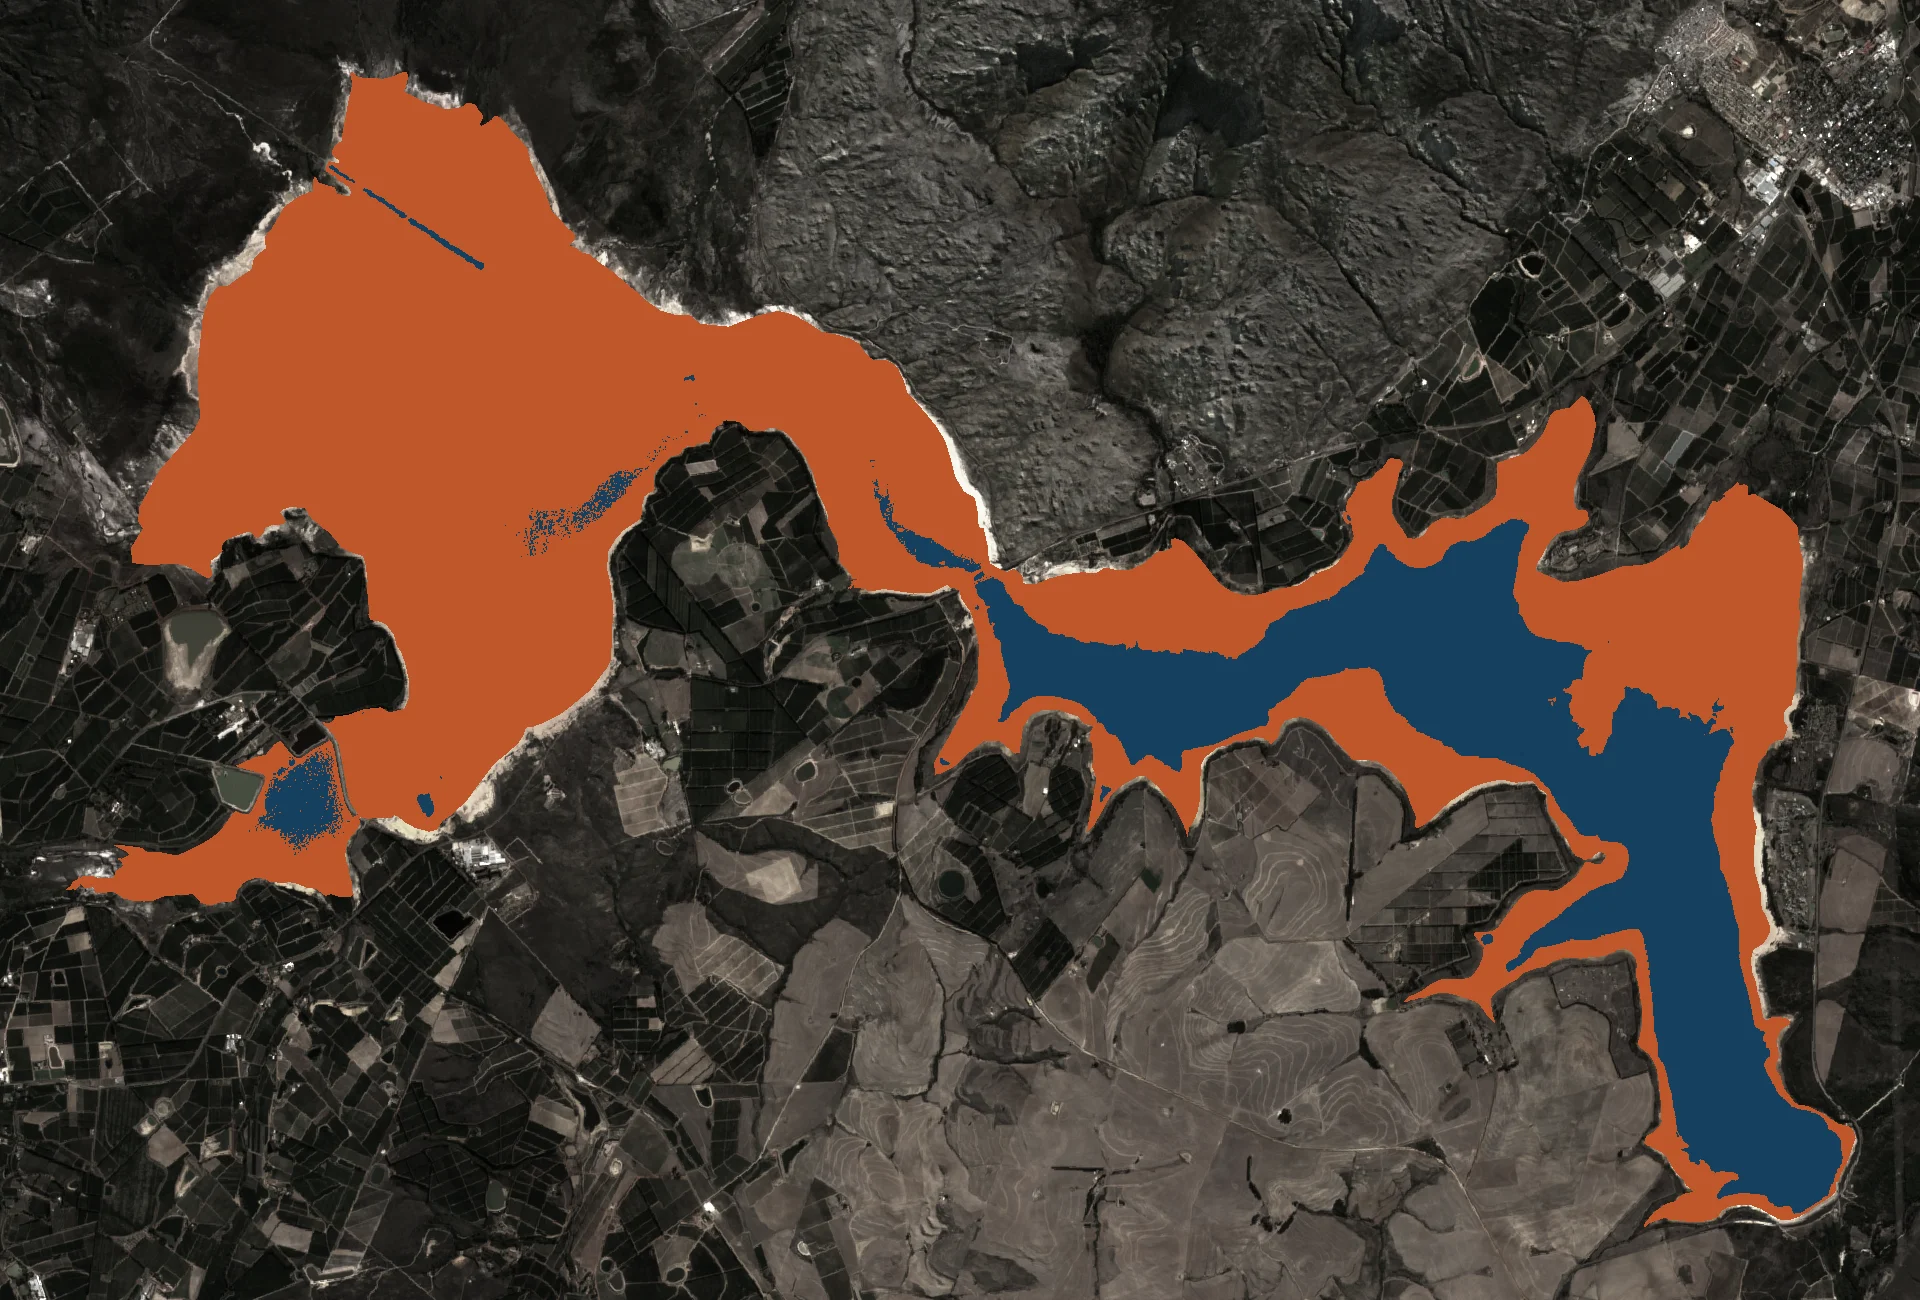
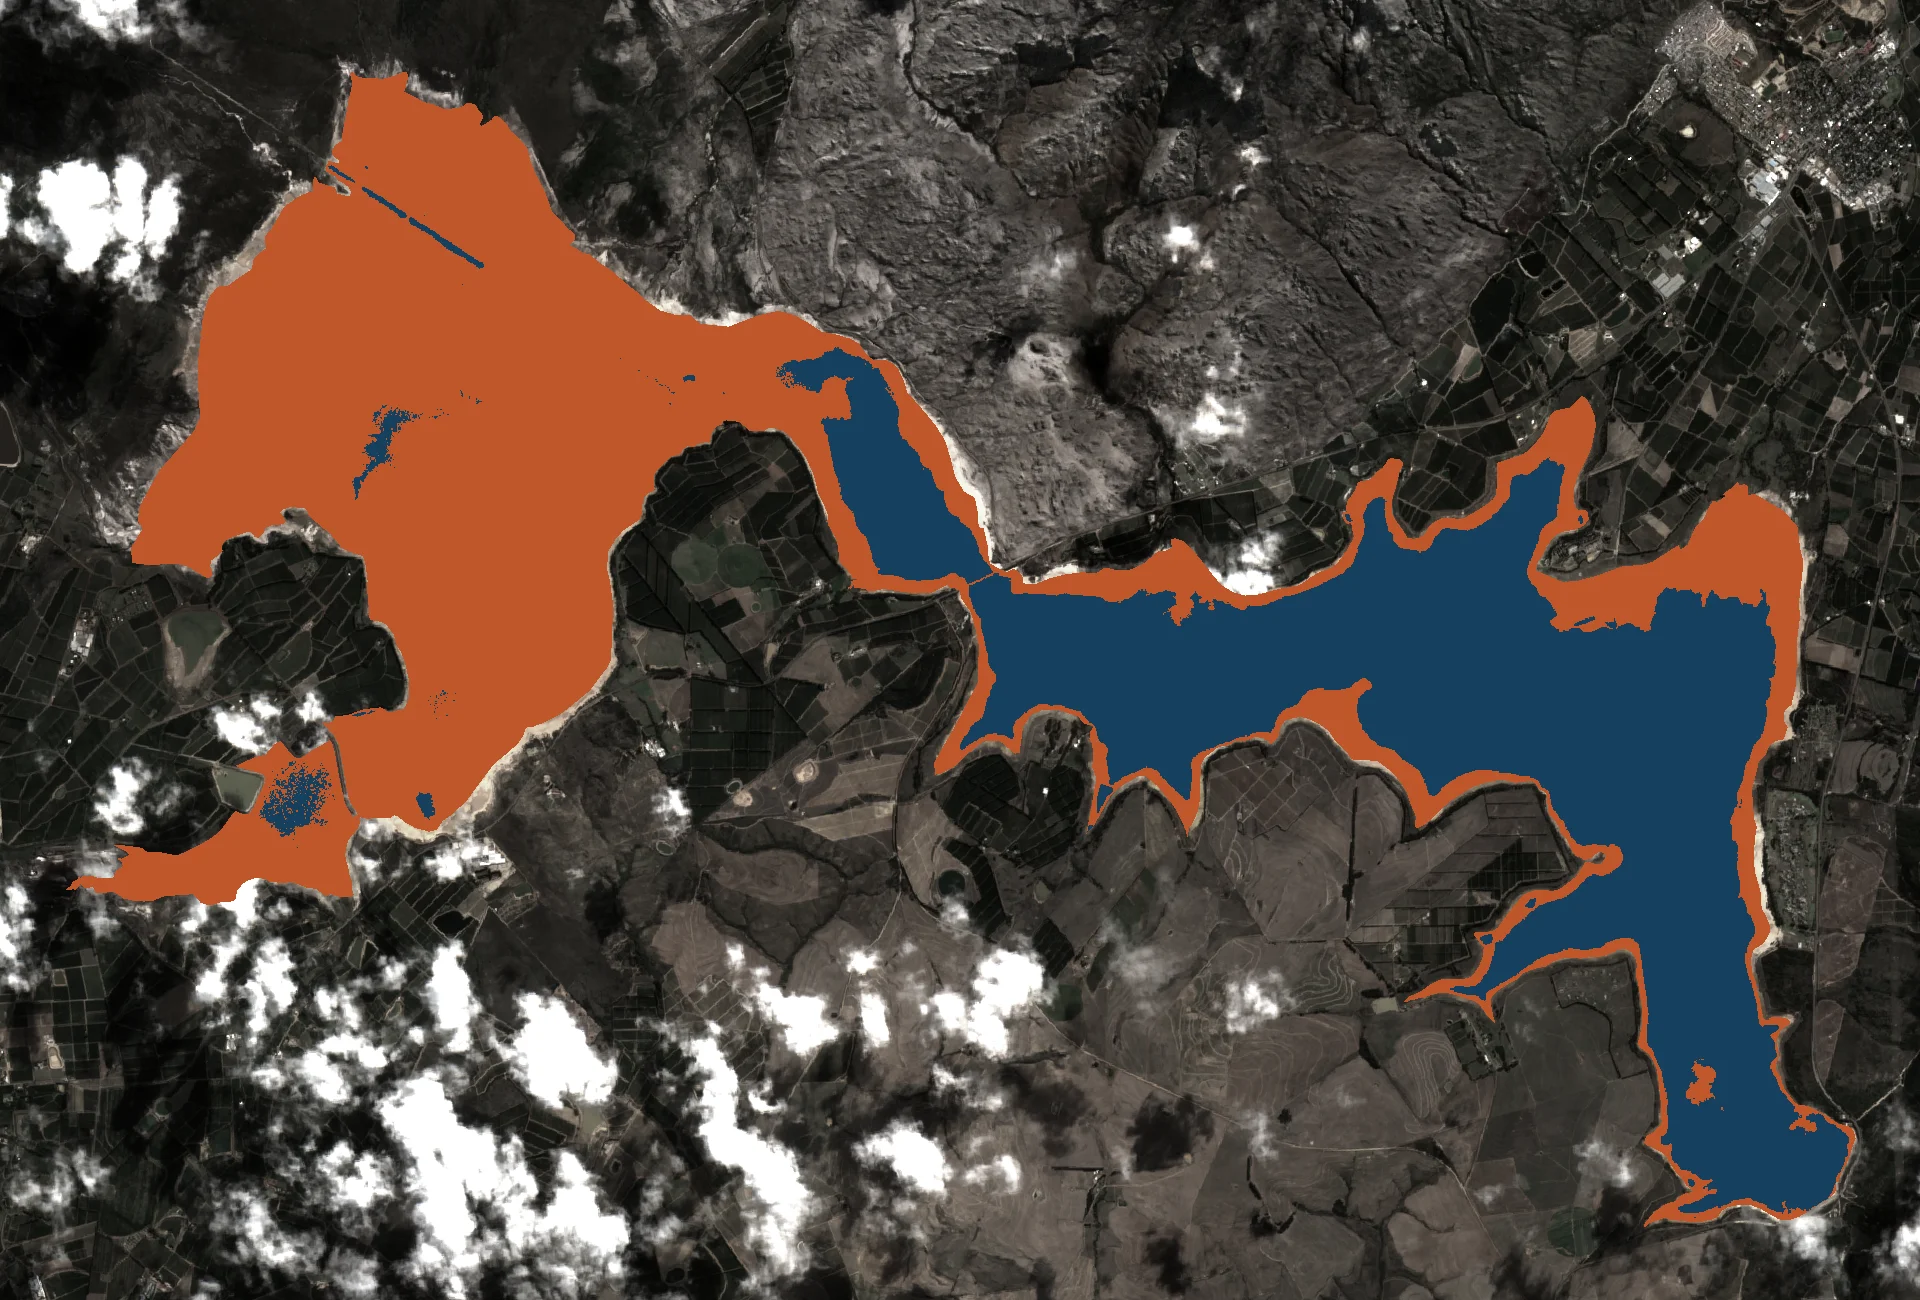
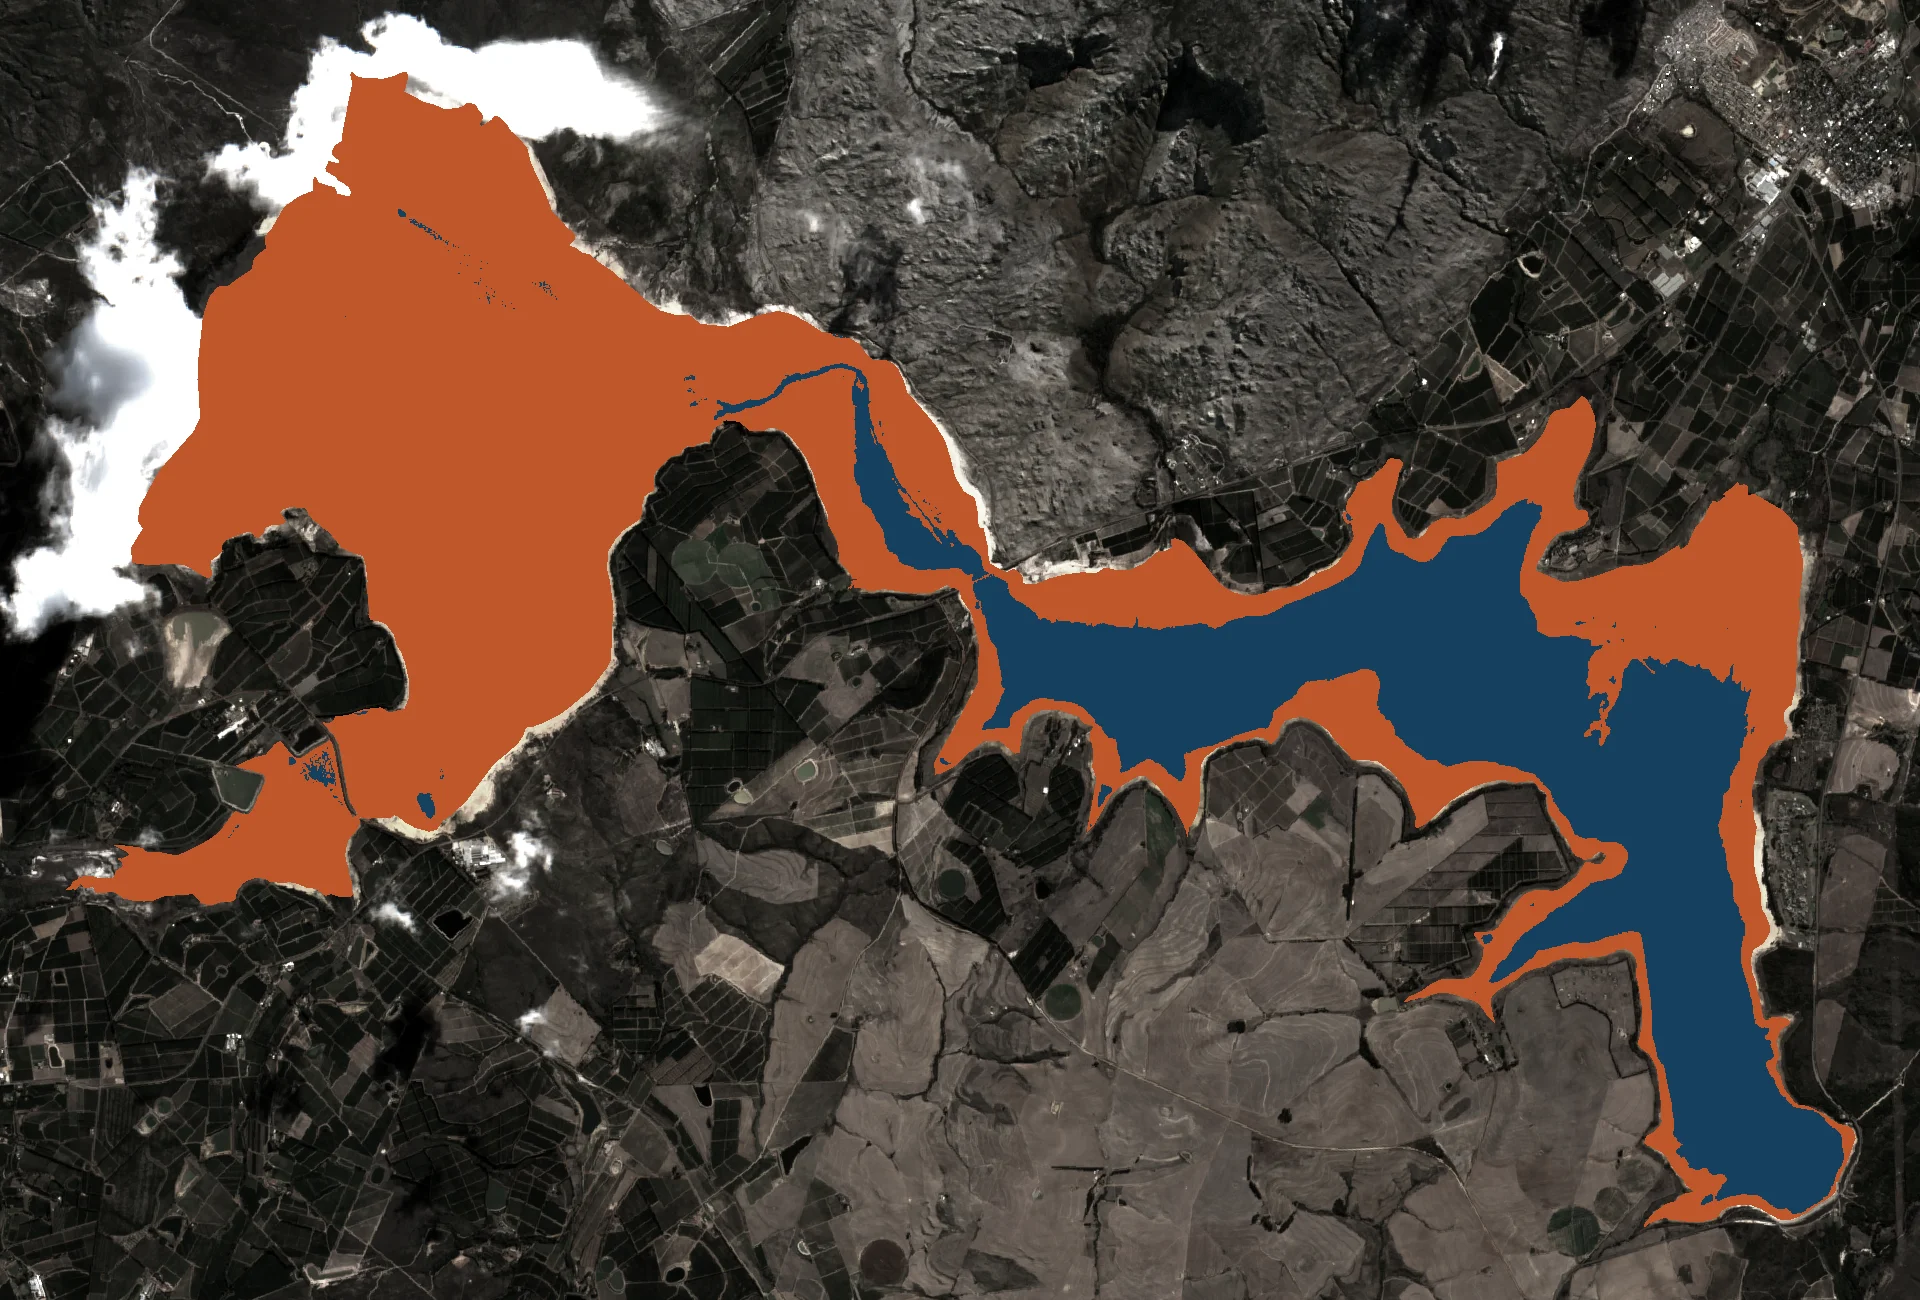
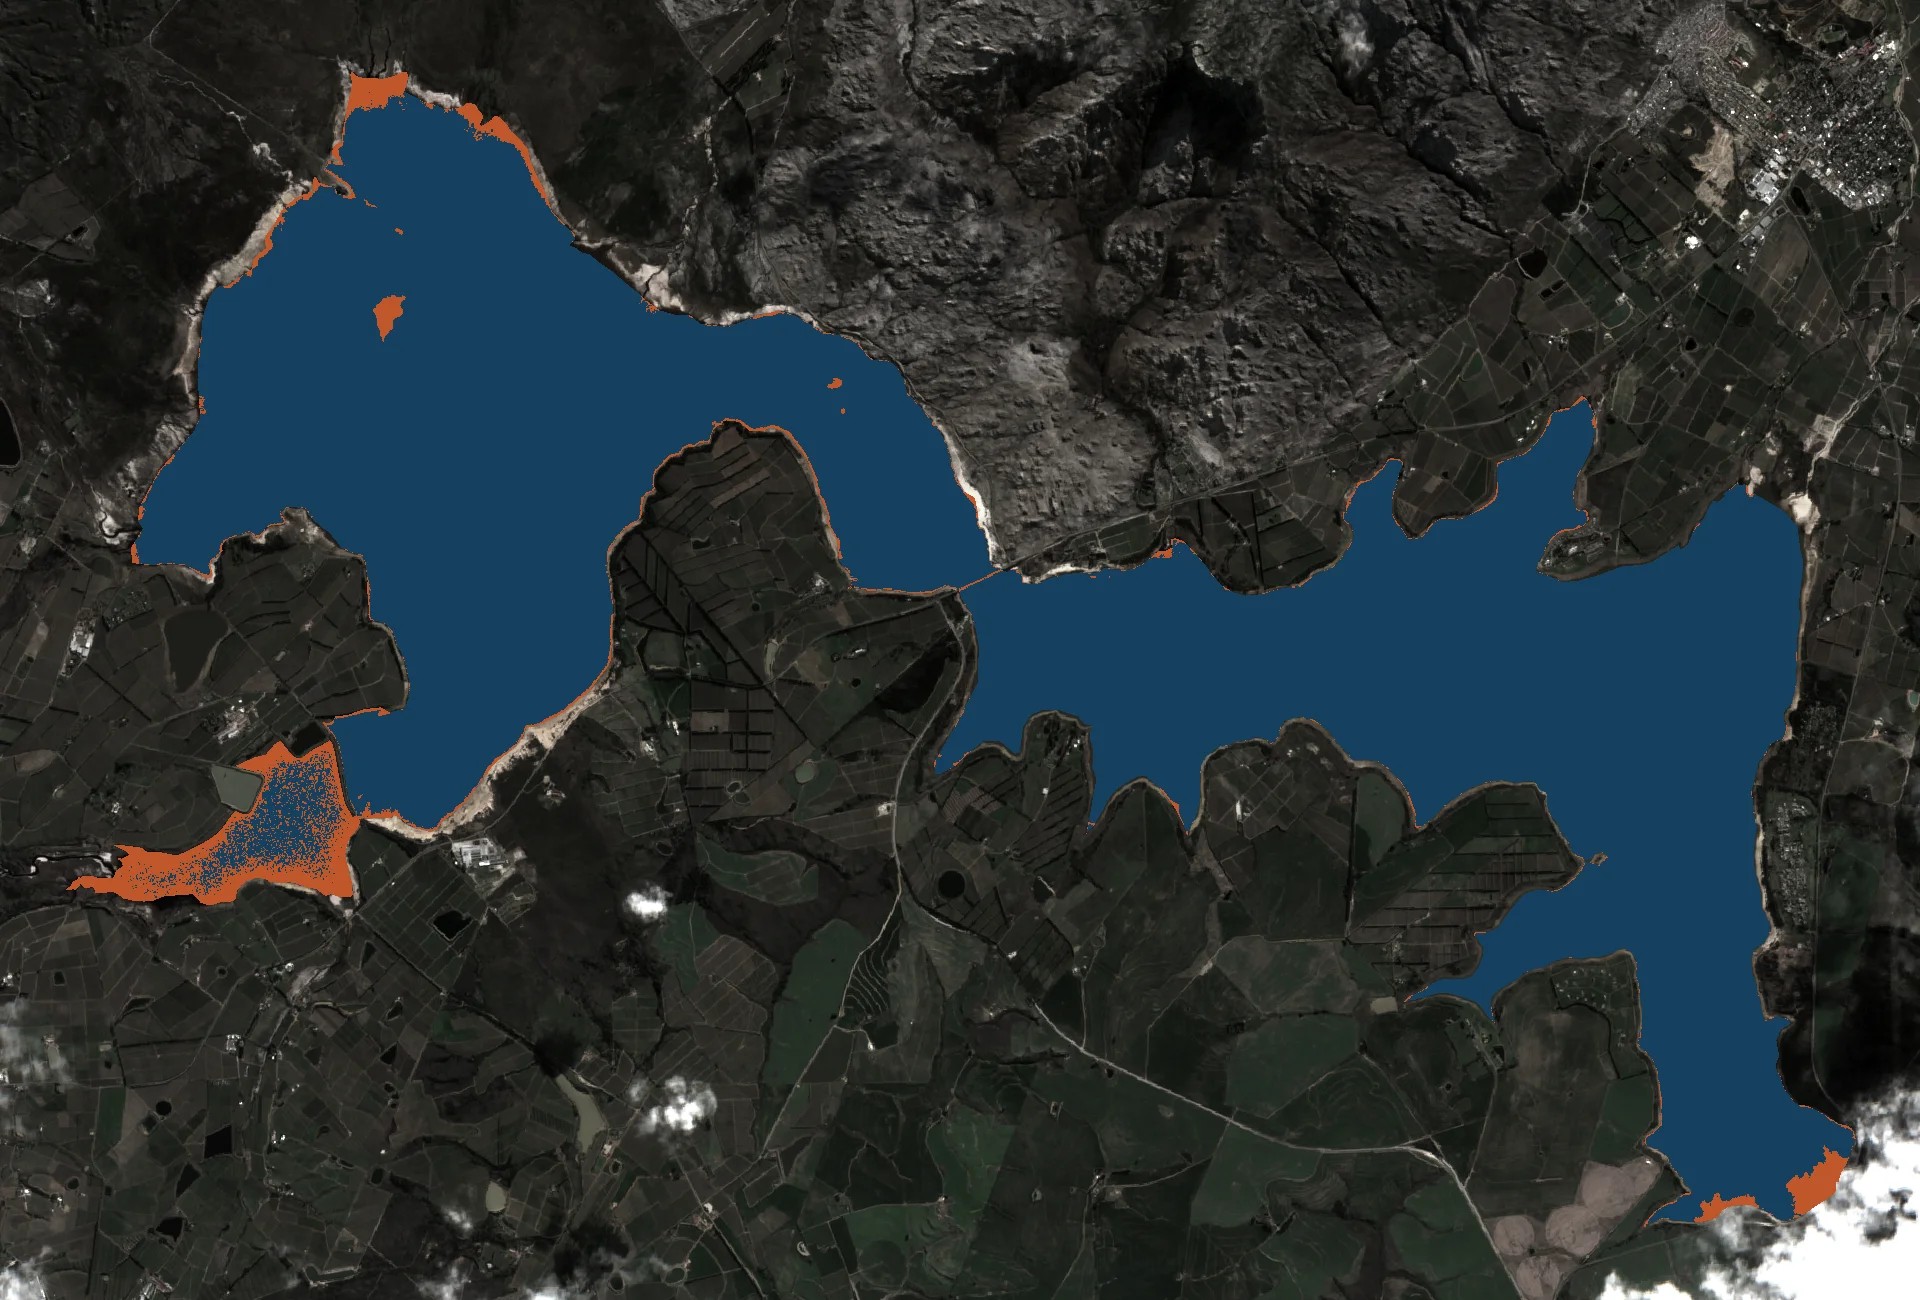
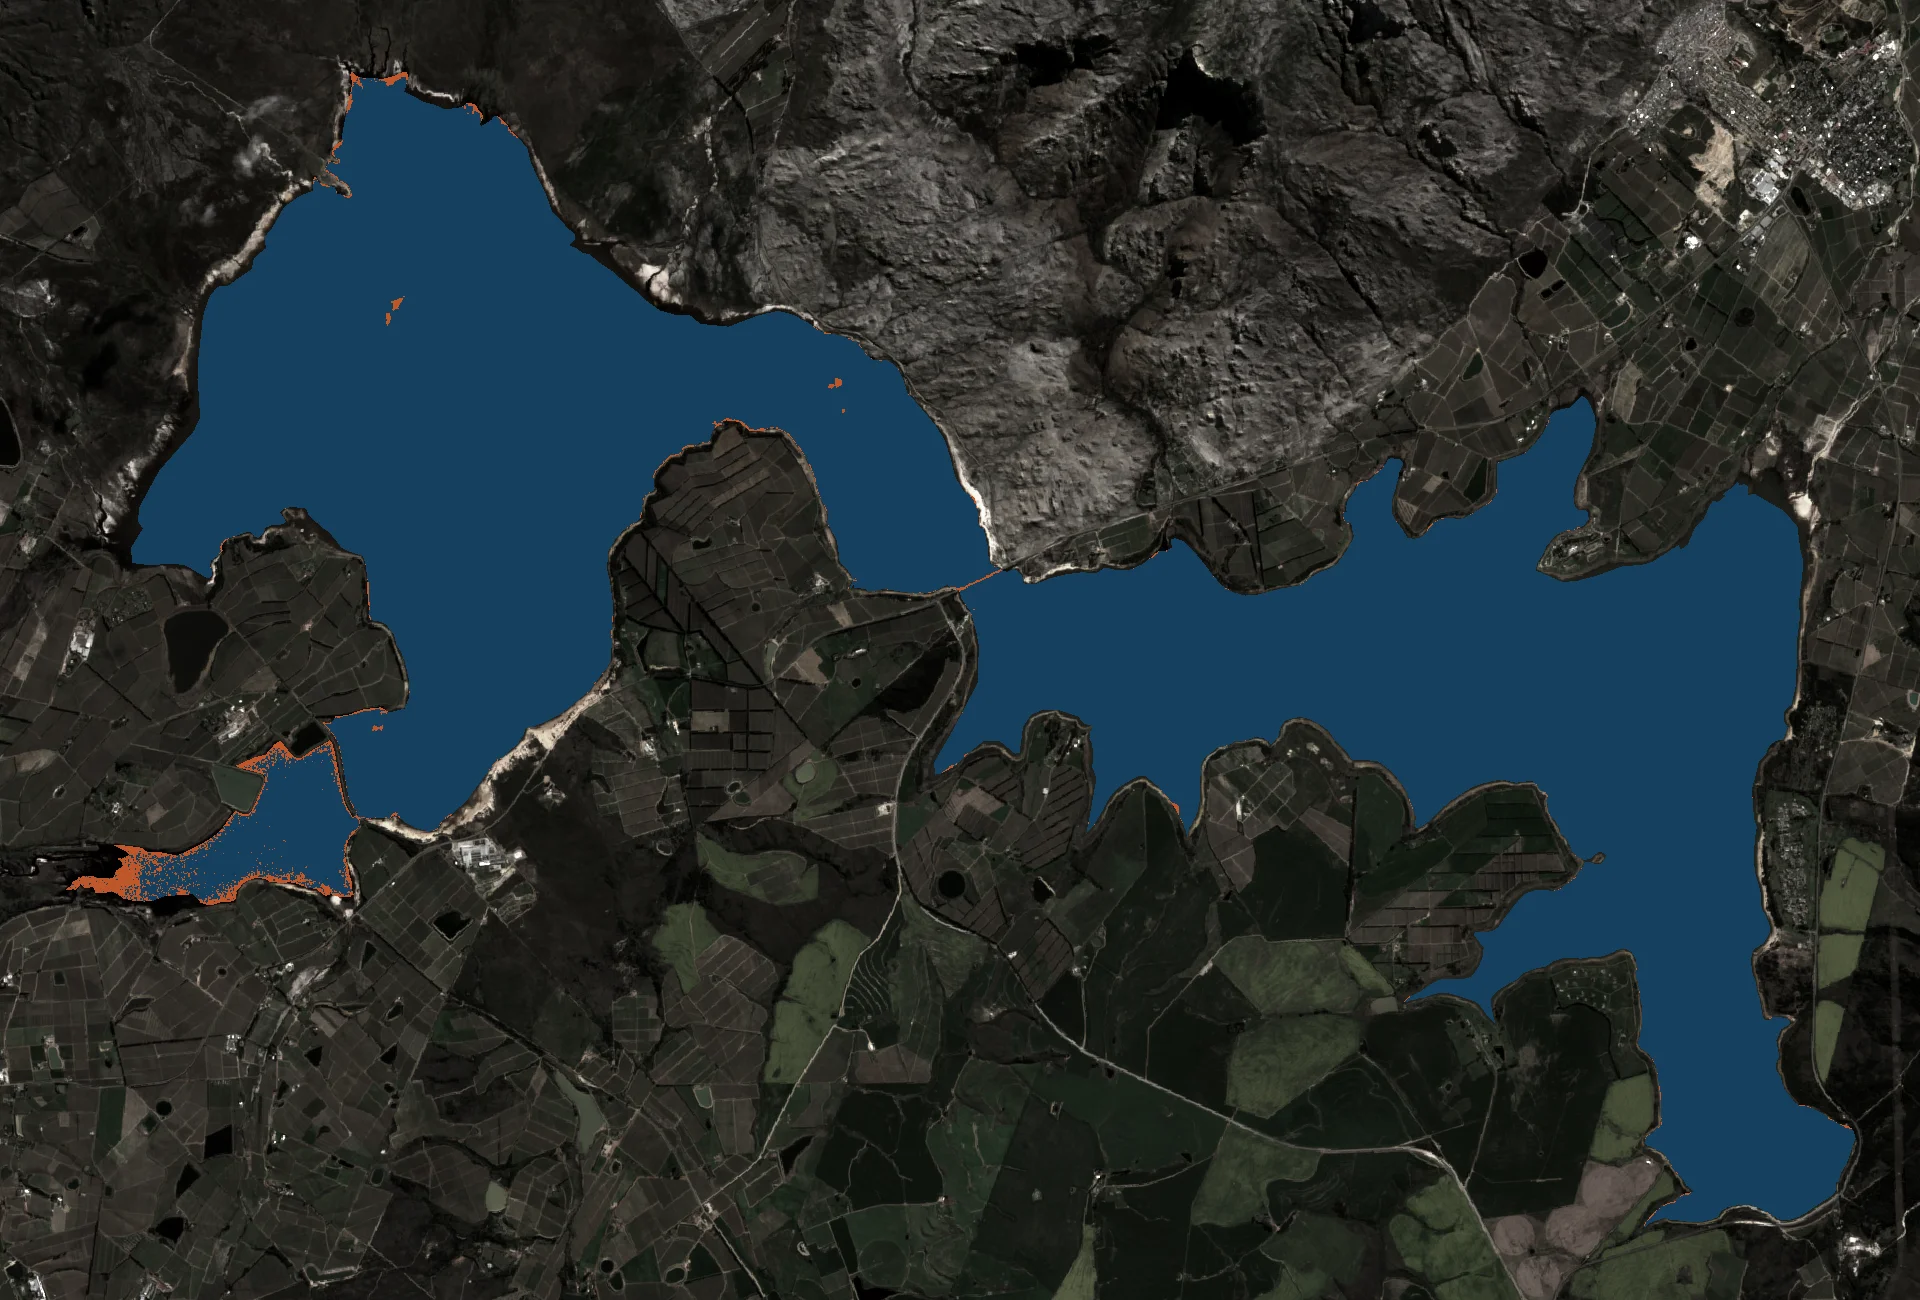
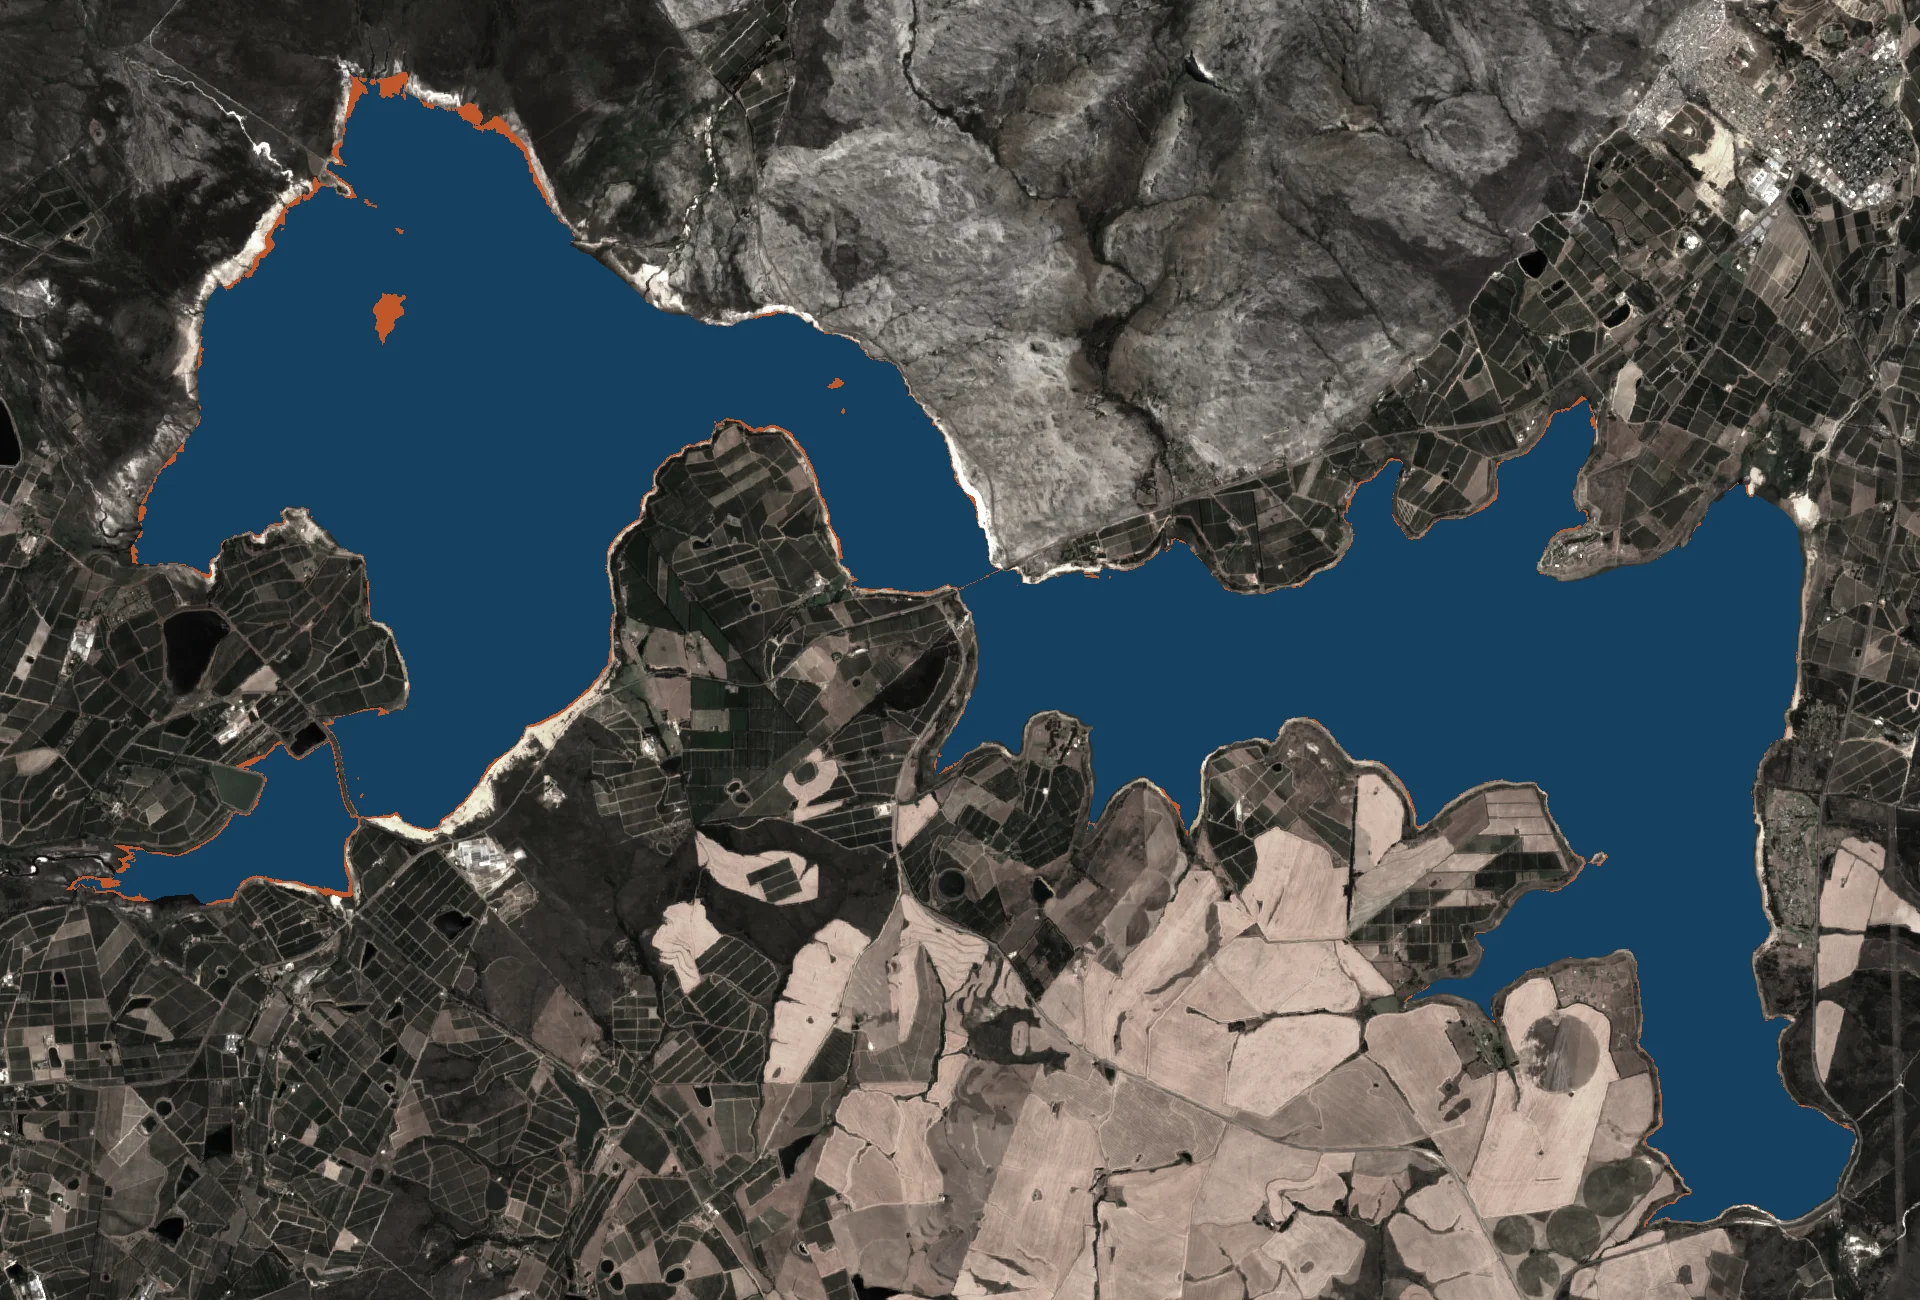
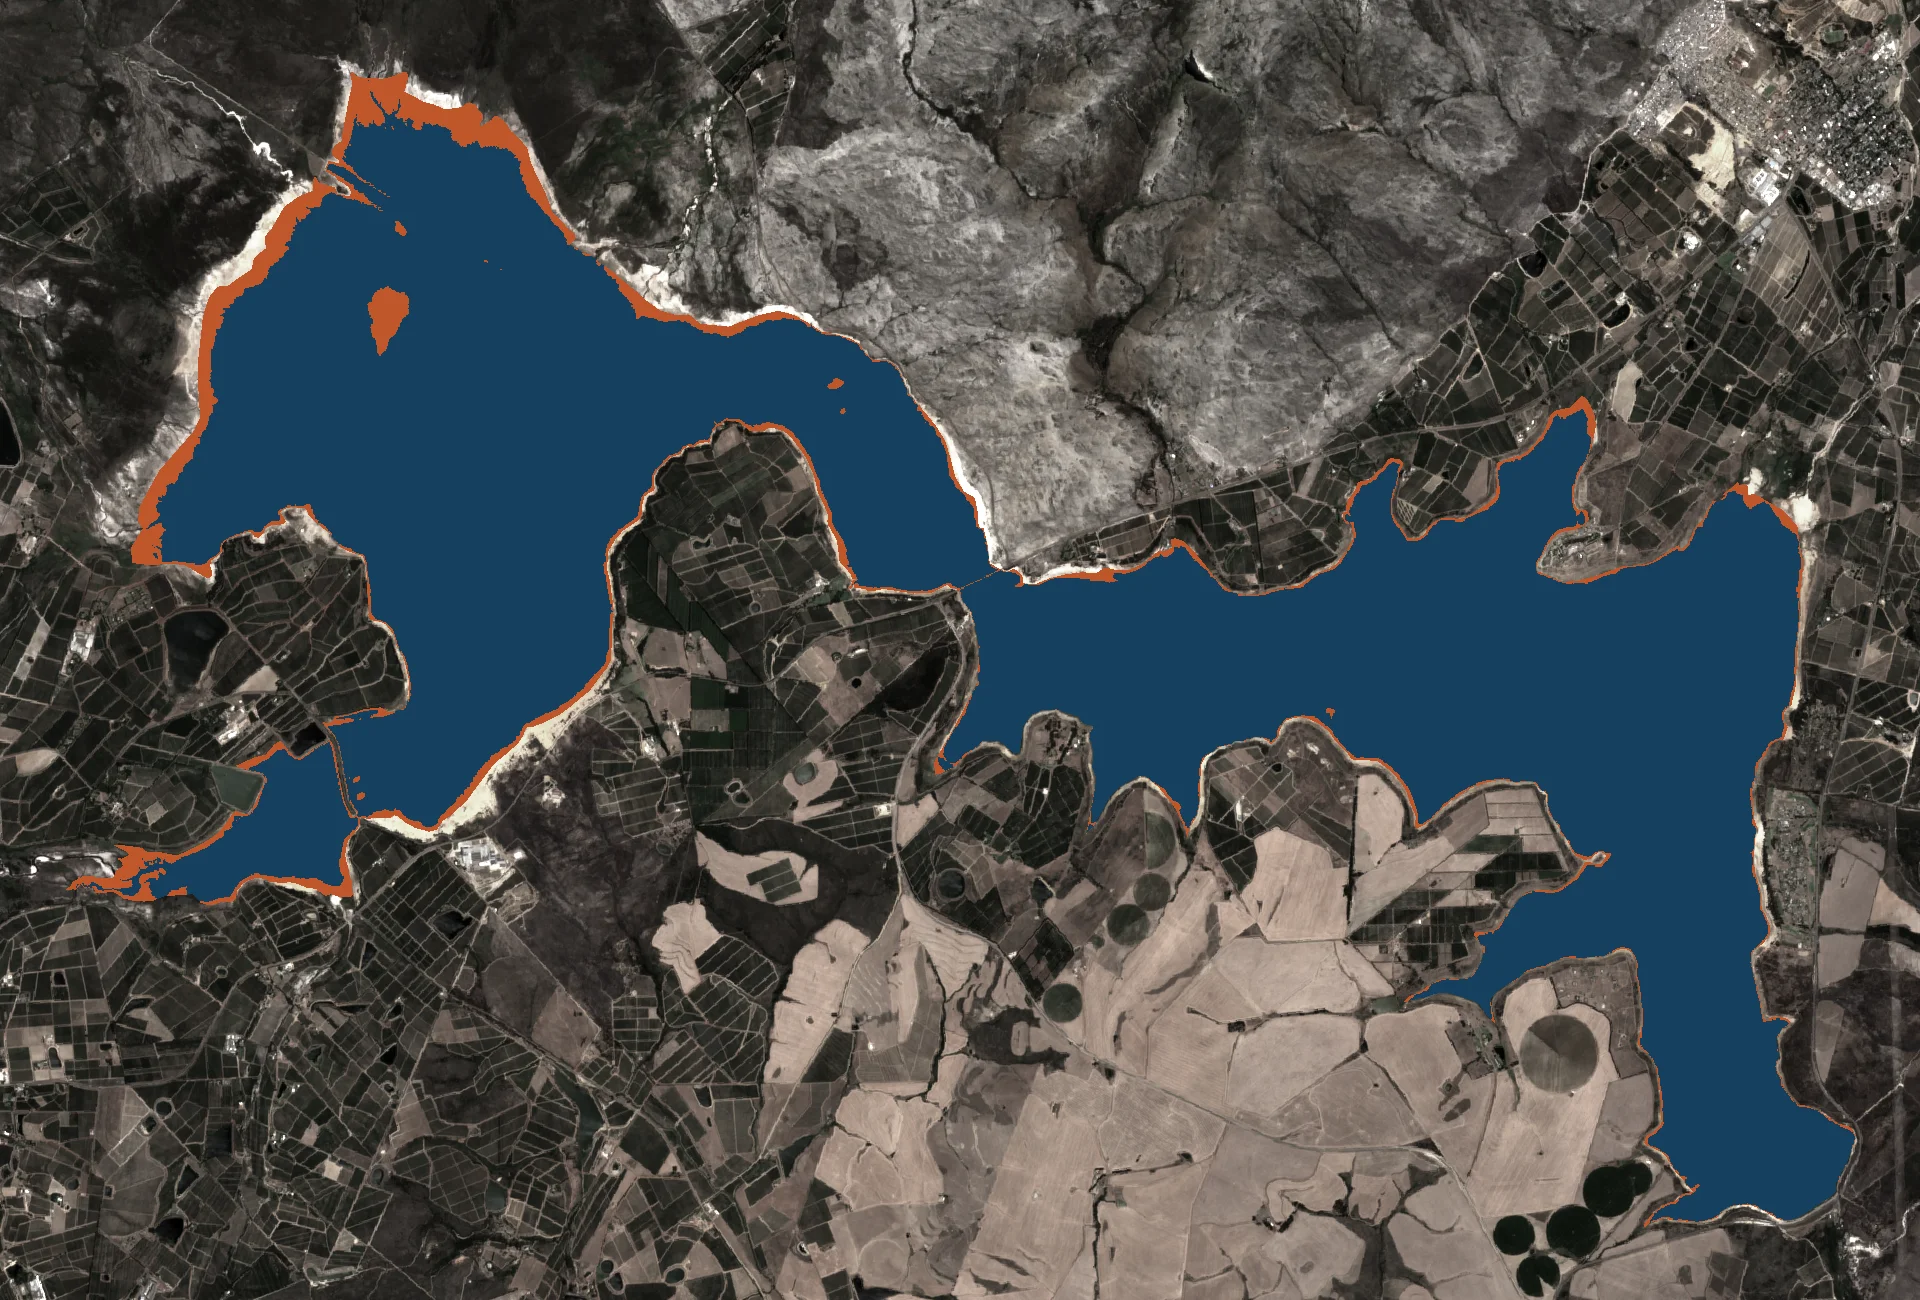
The last decade, end of summer.
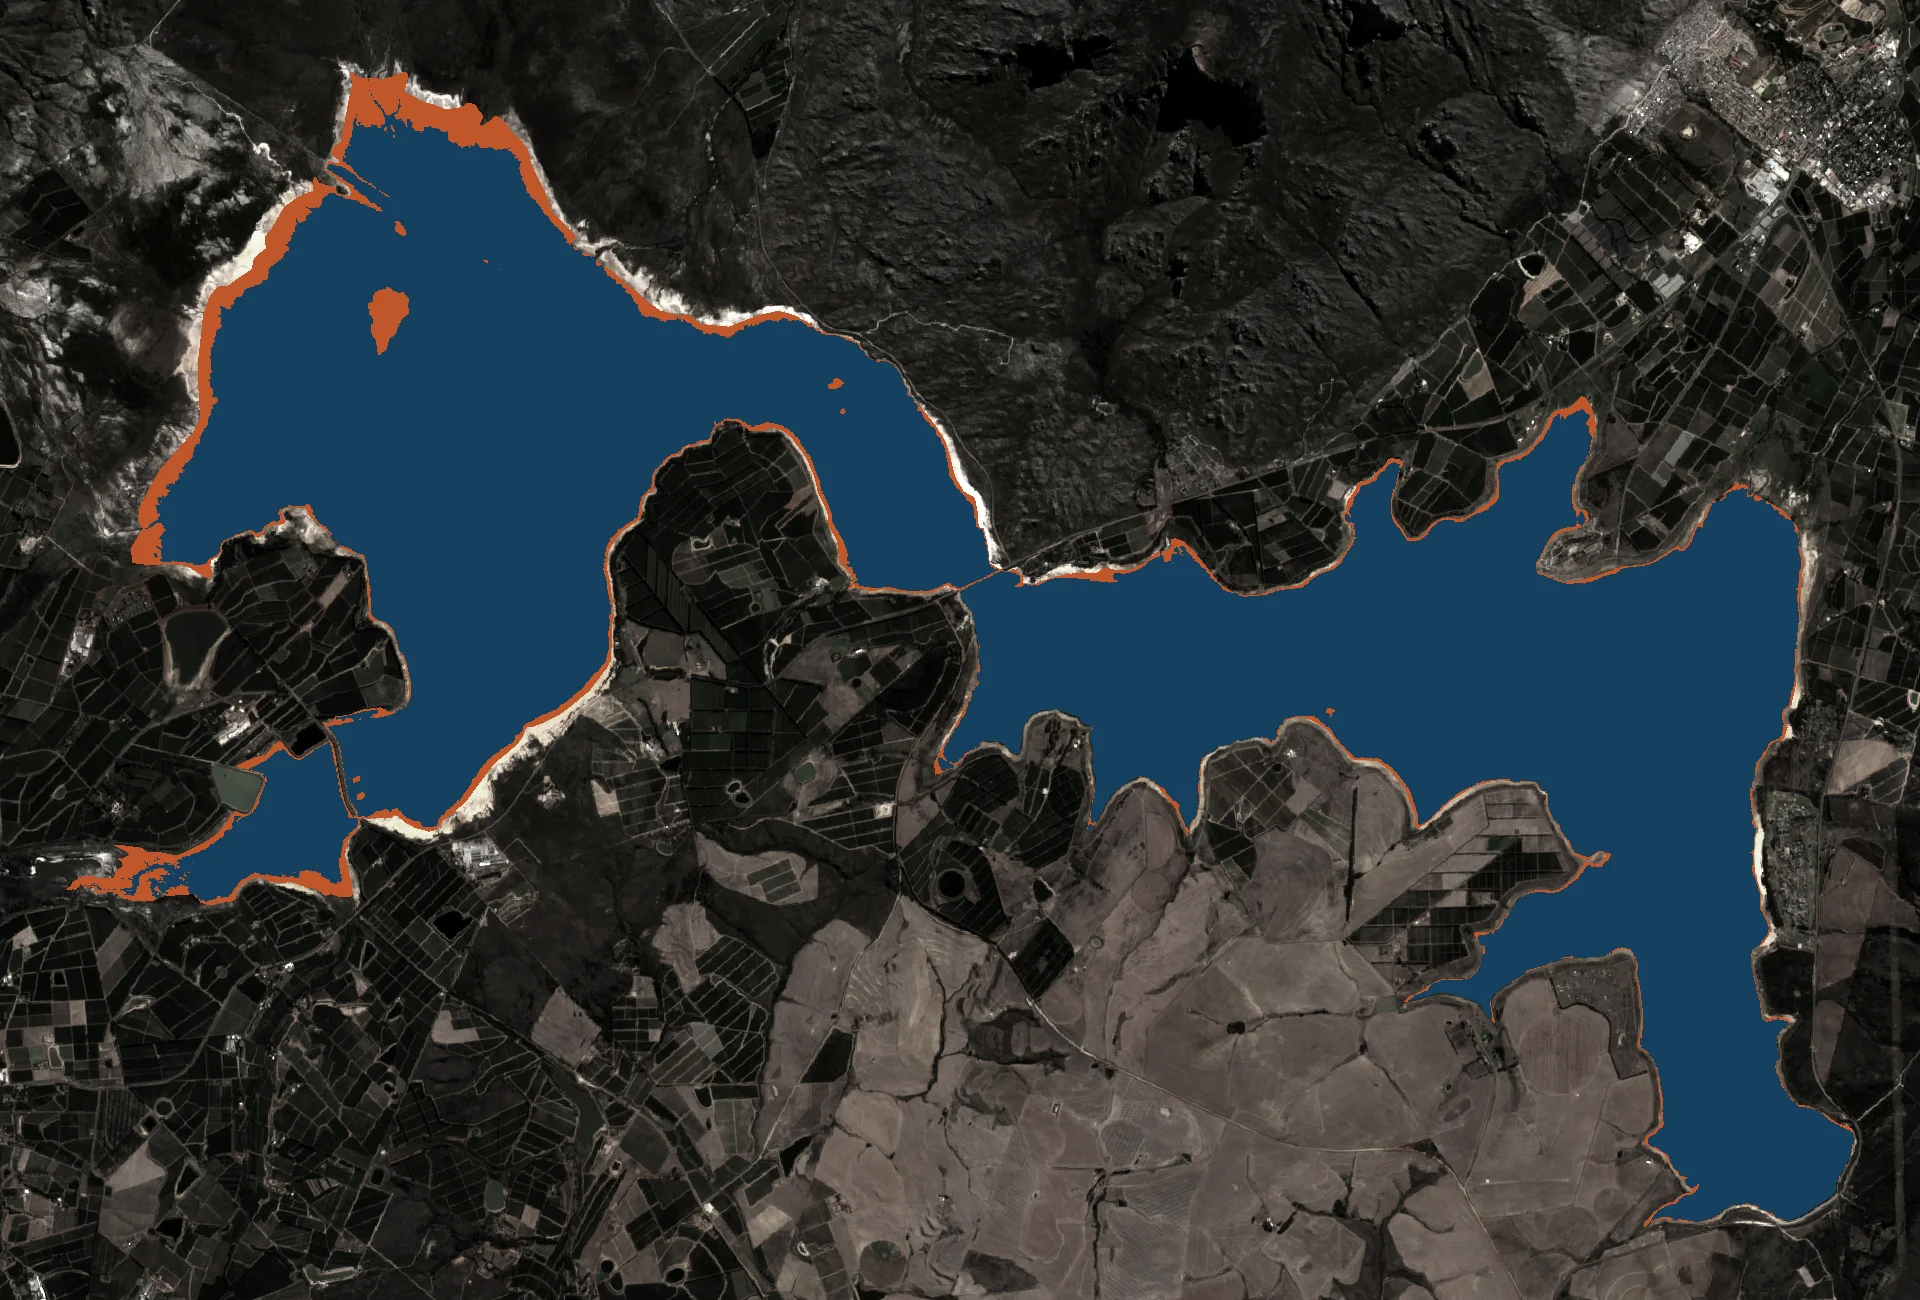
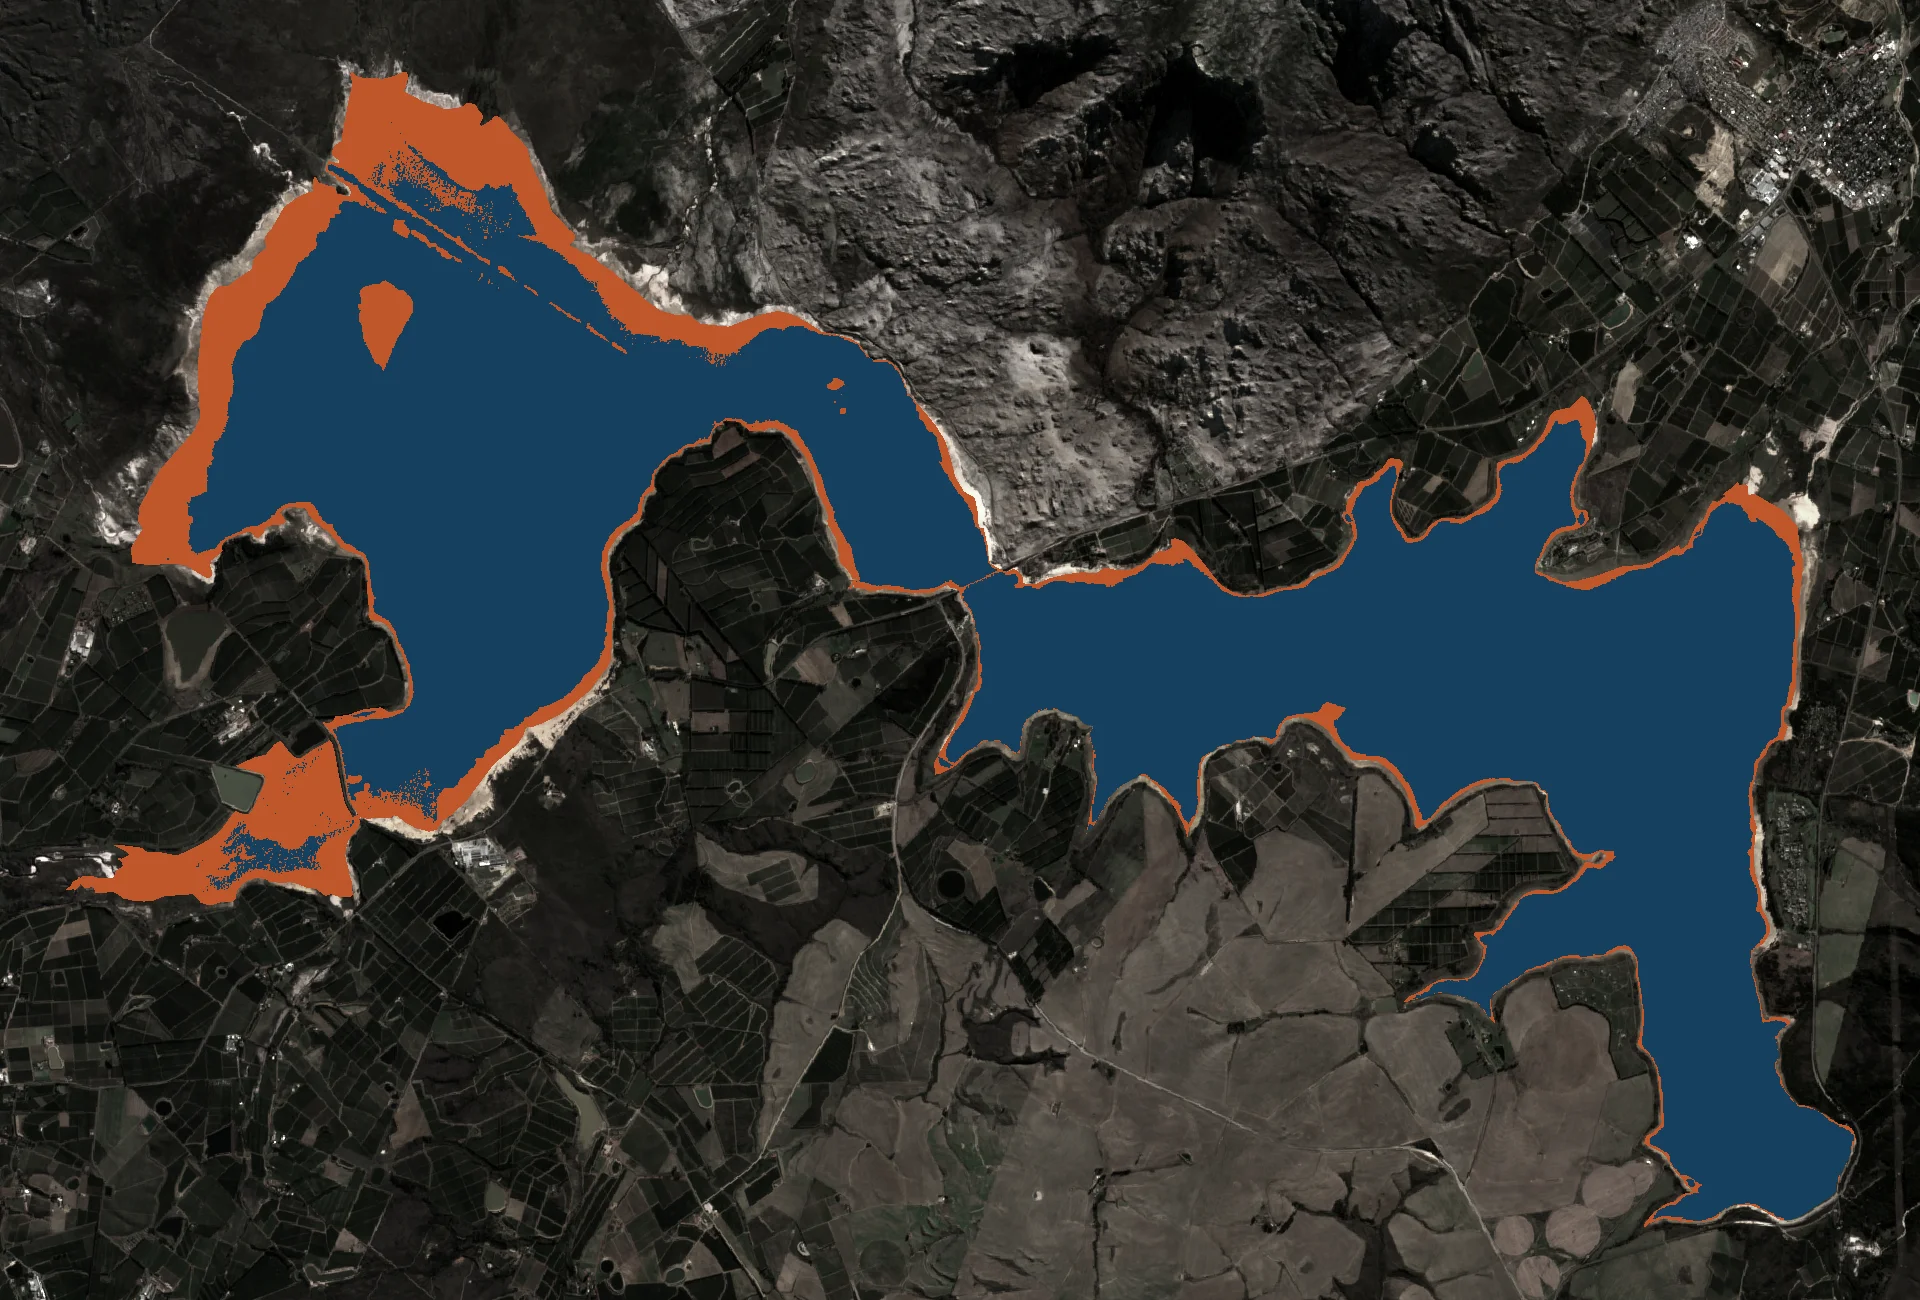
One Sentinel-2 capture per year, taken at the end of each summer when the dam is at its lowest. Watch the lakebed expand through 2017–18, the slow refill of 2020–24, and what we look like right now.
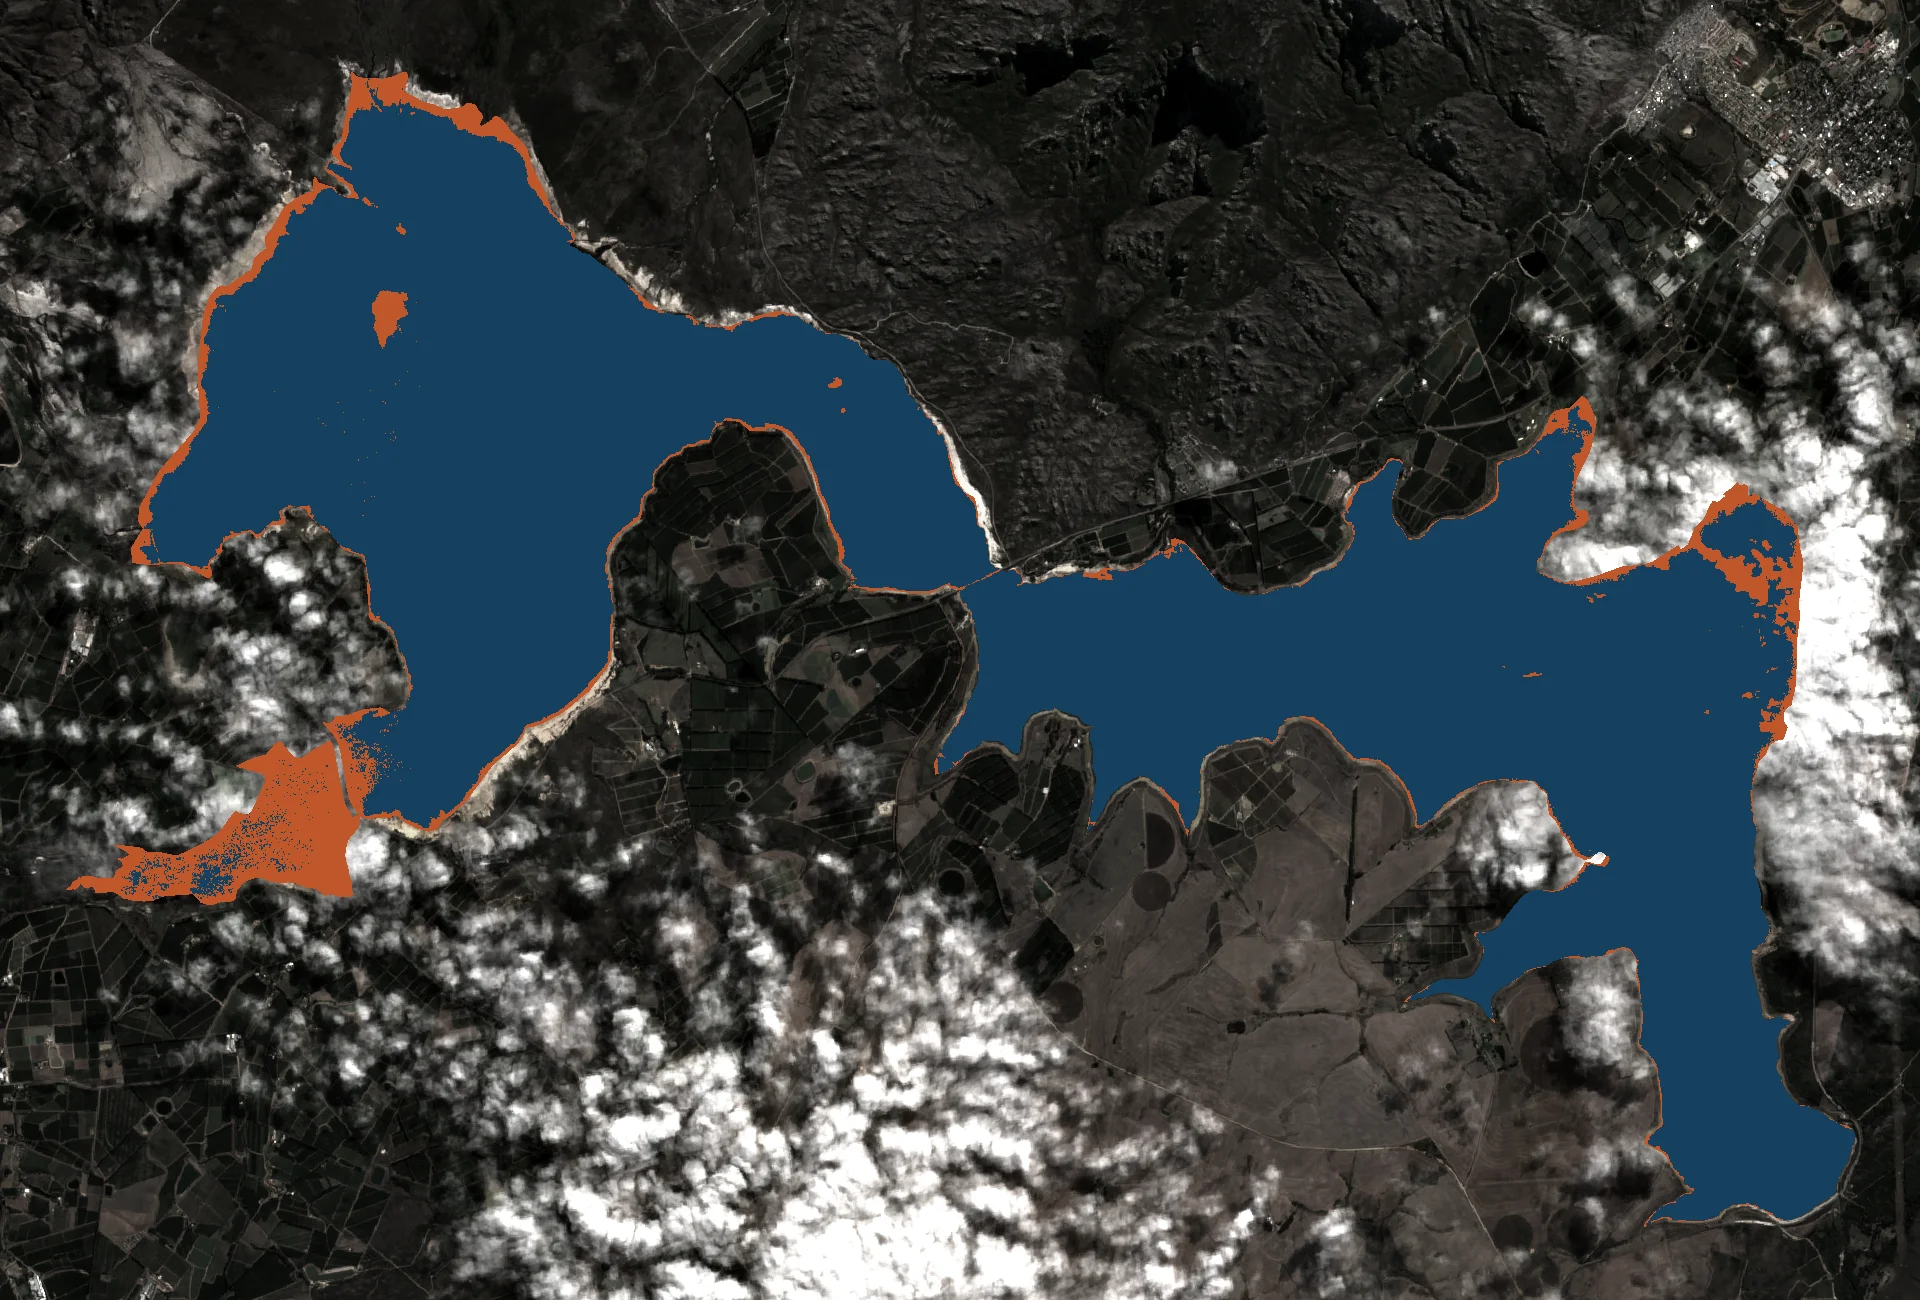
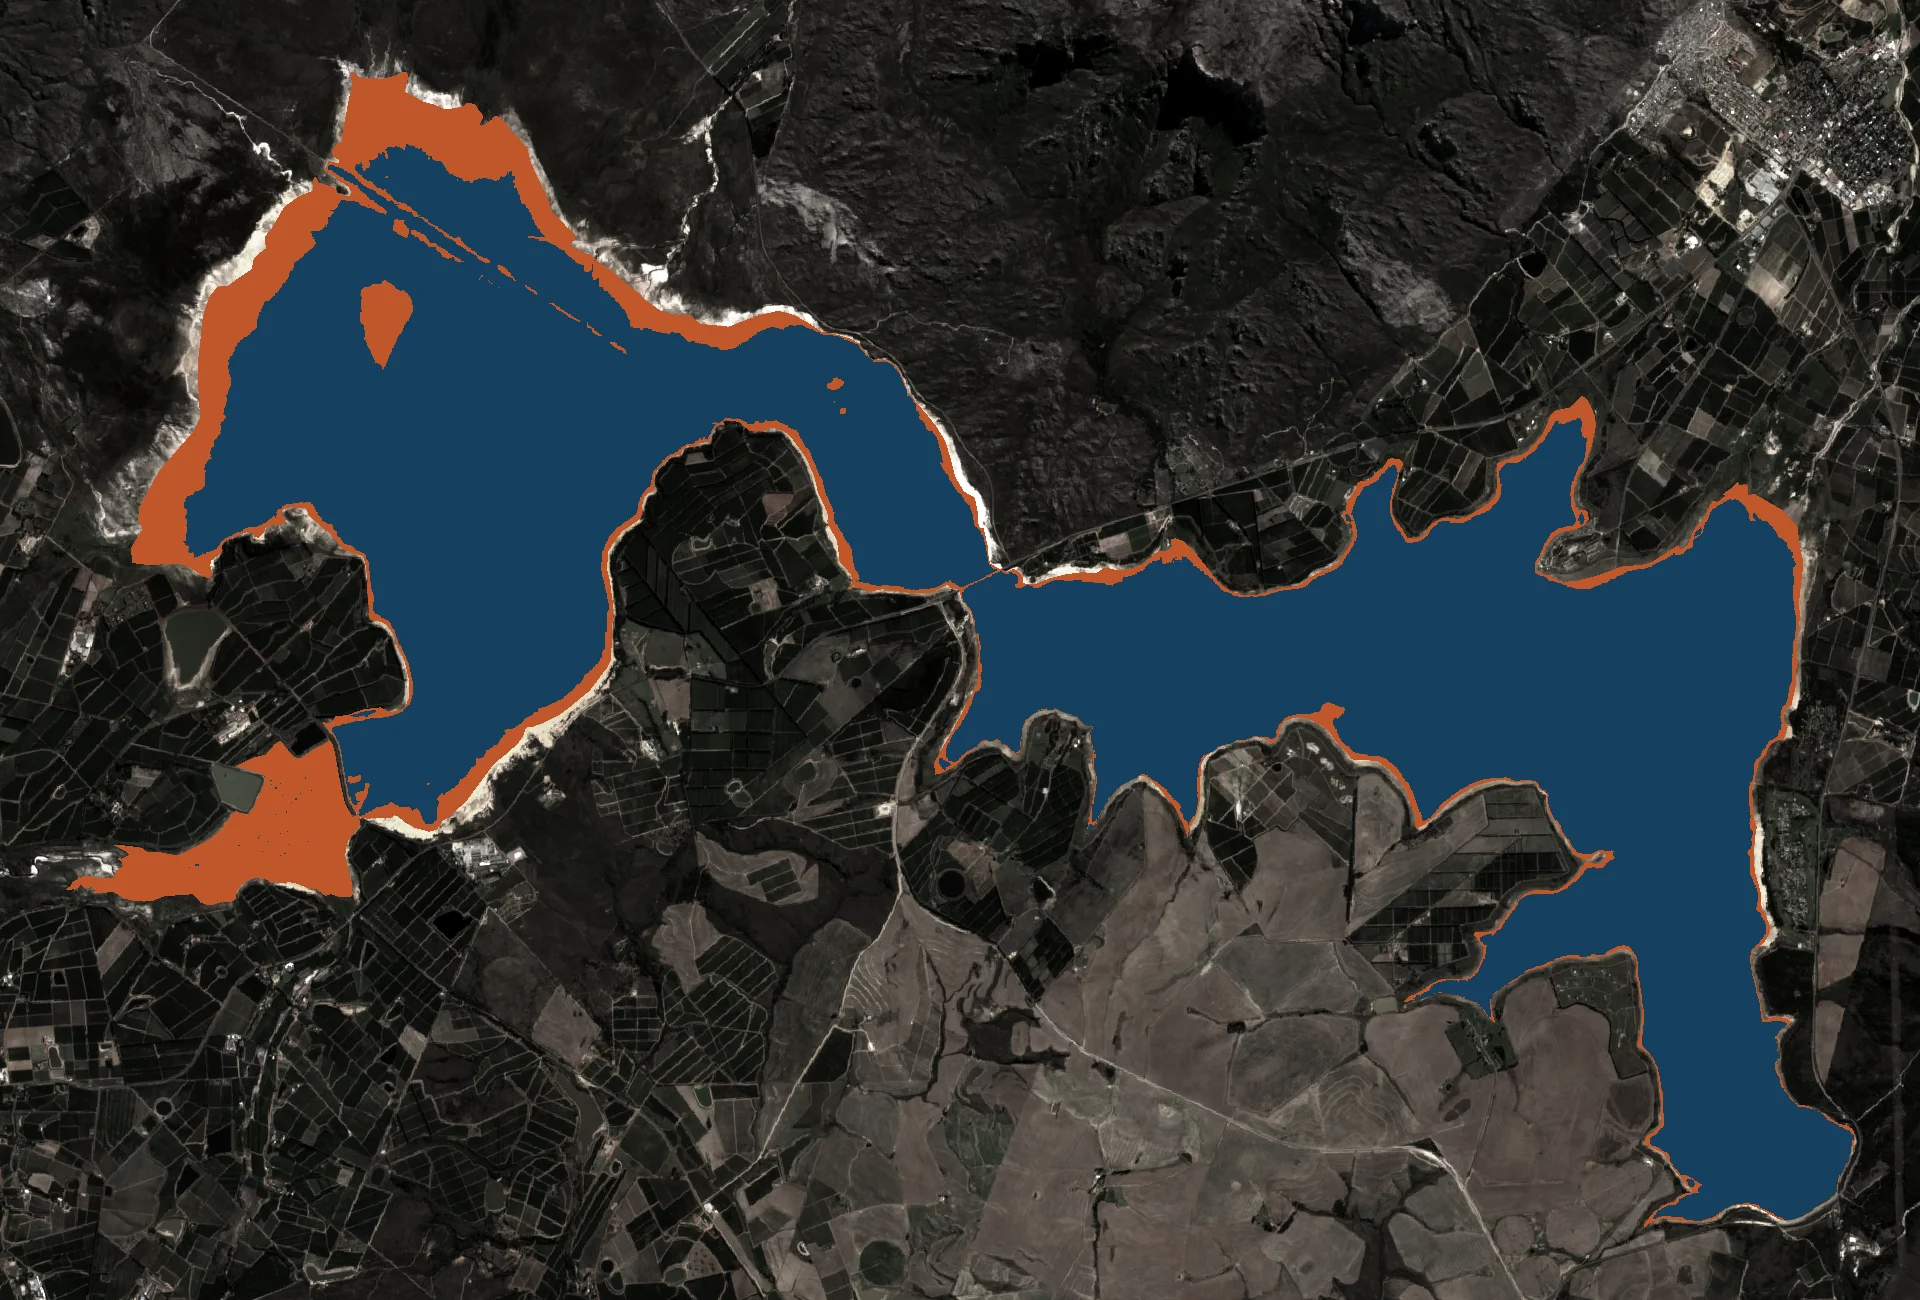
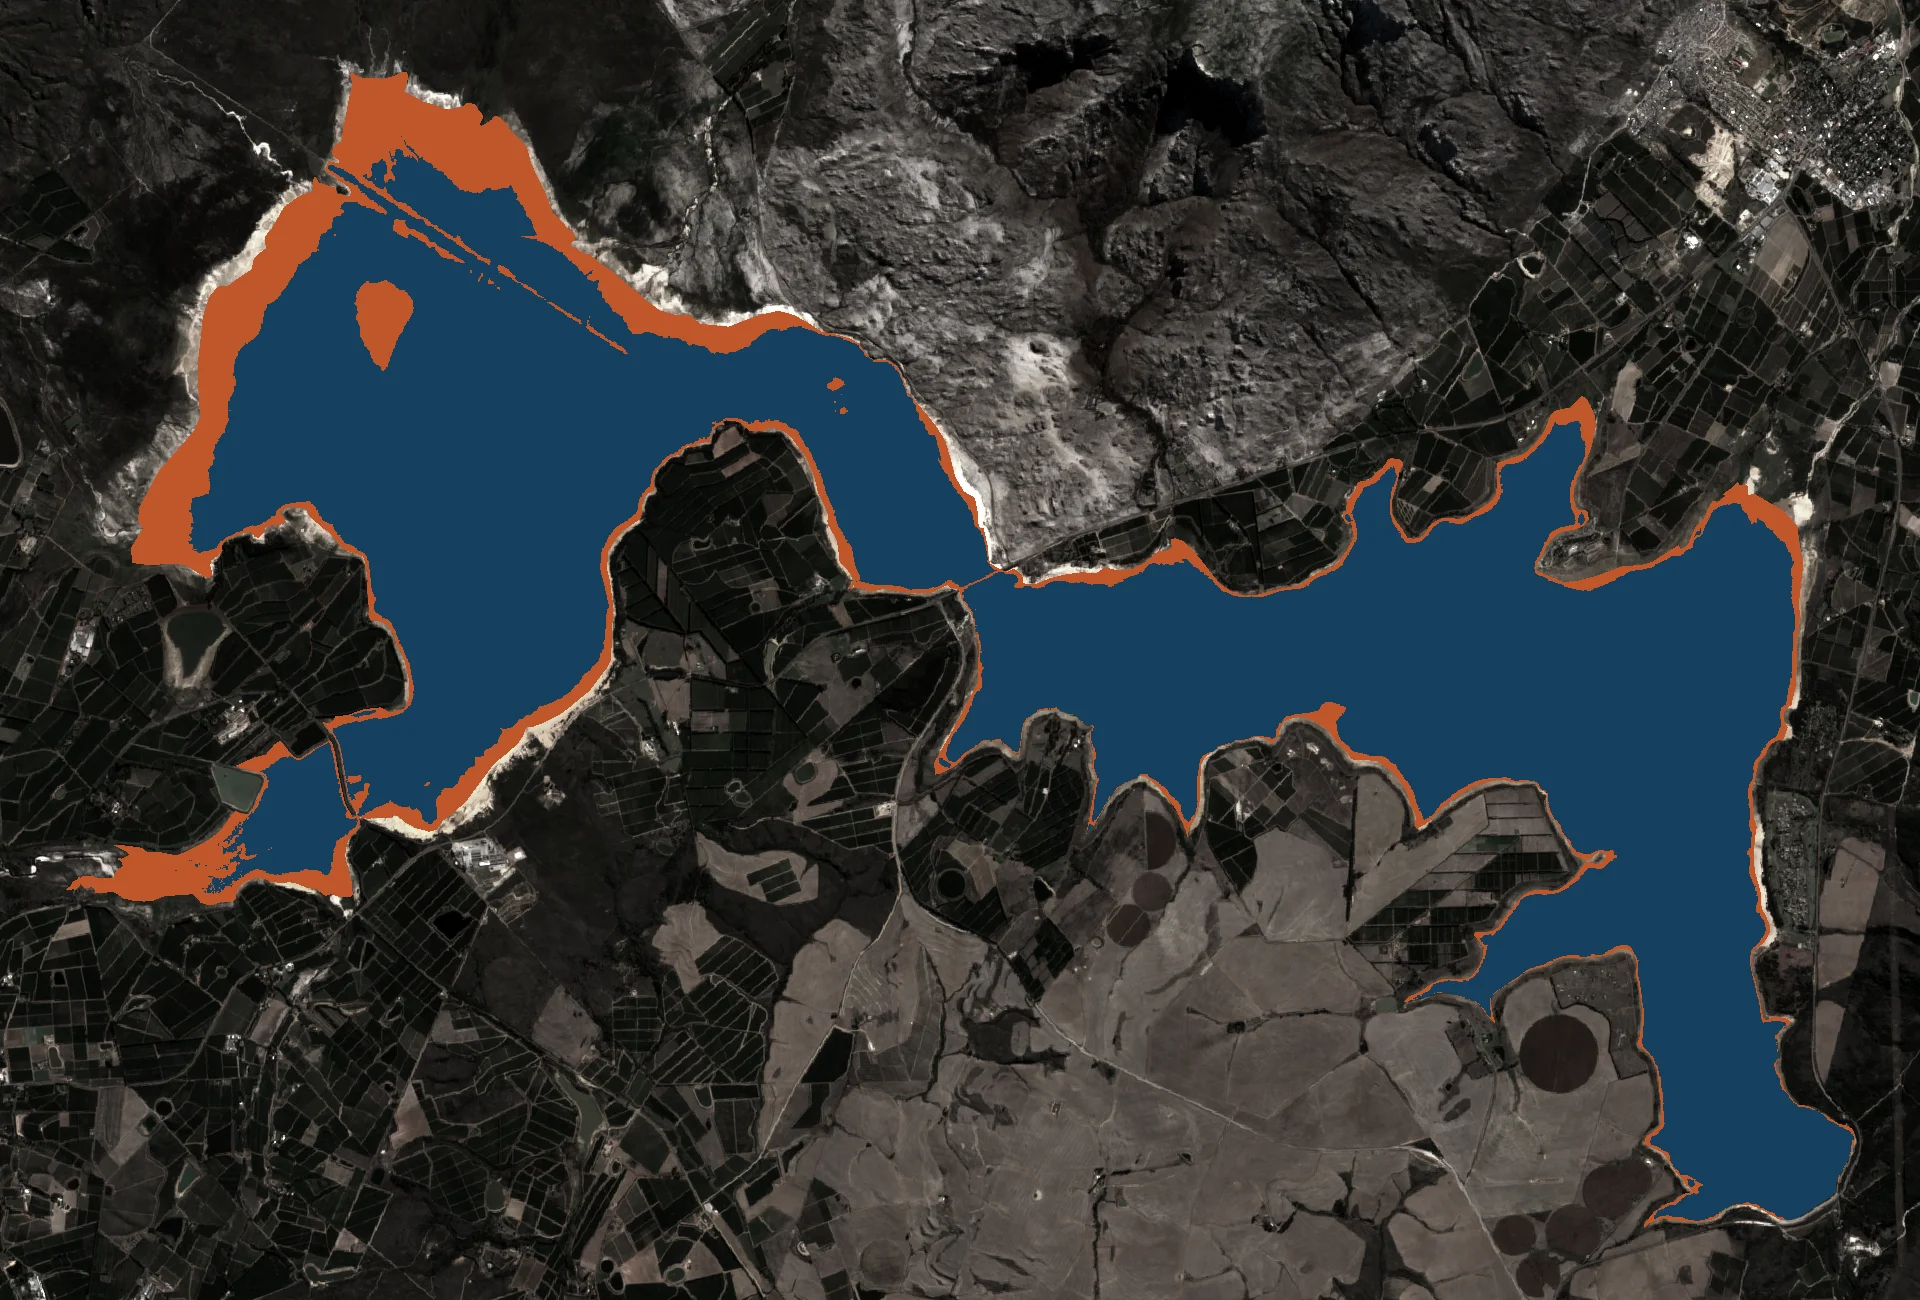
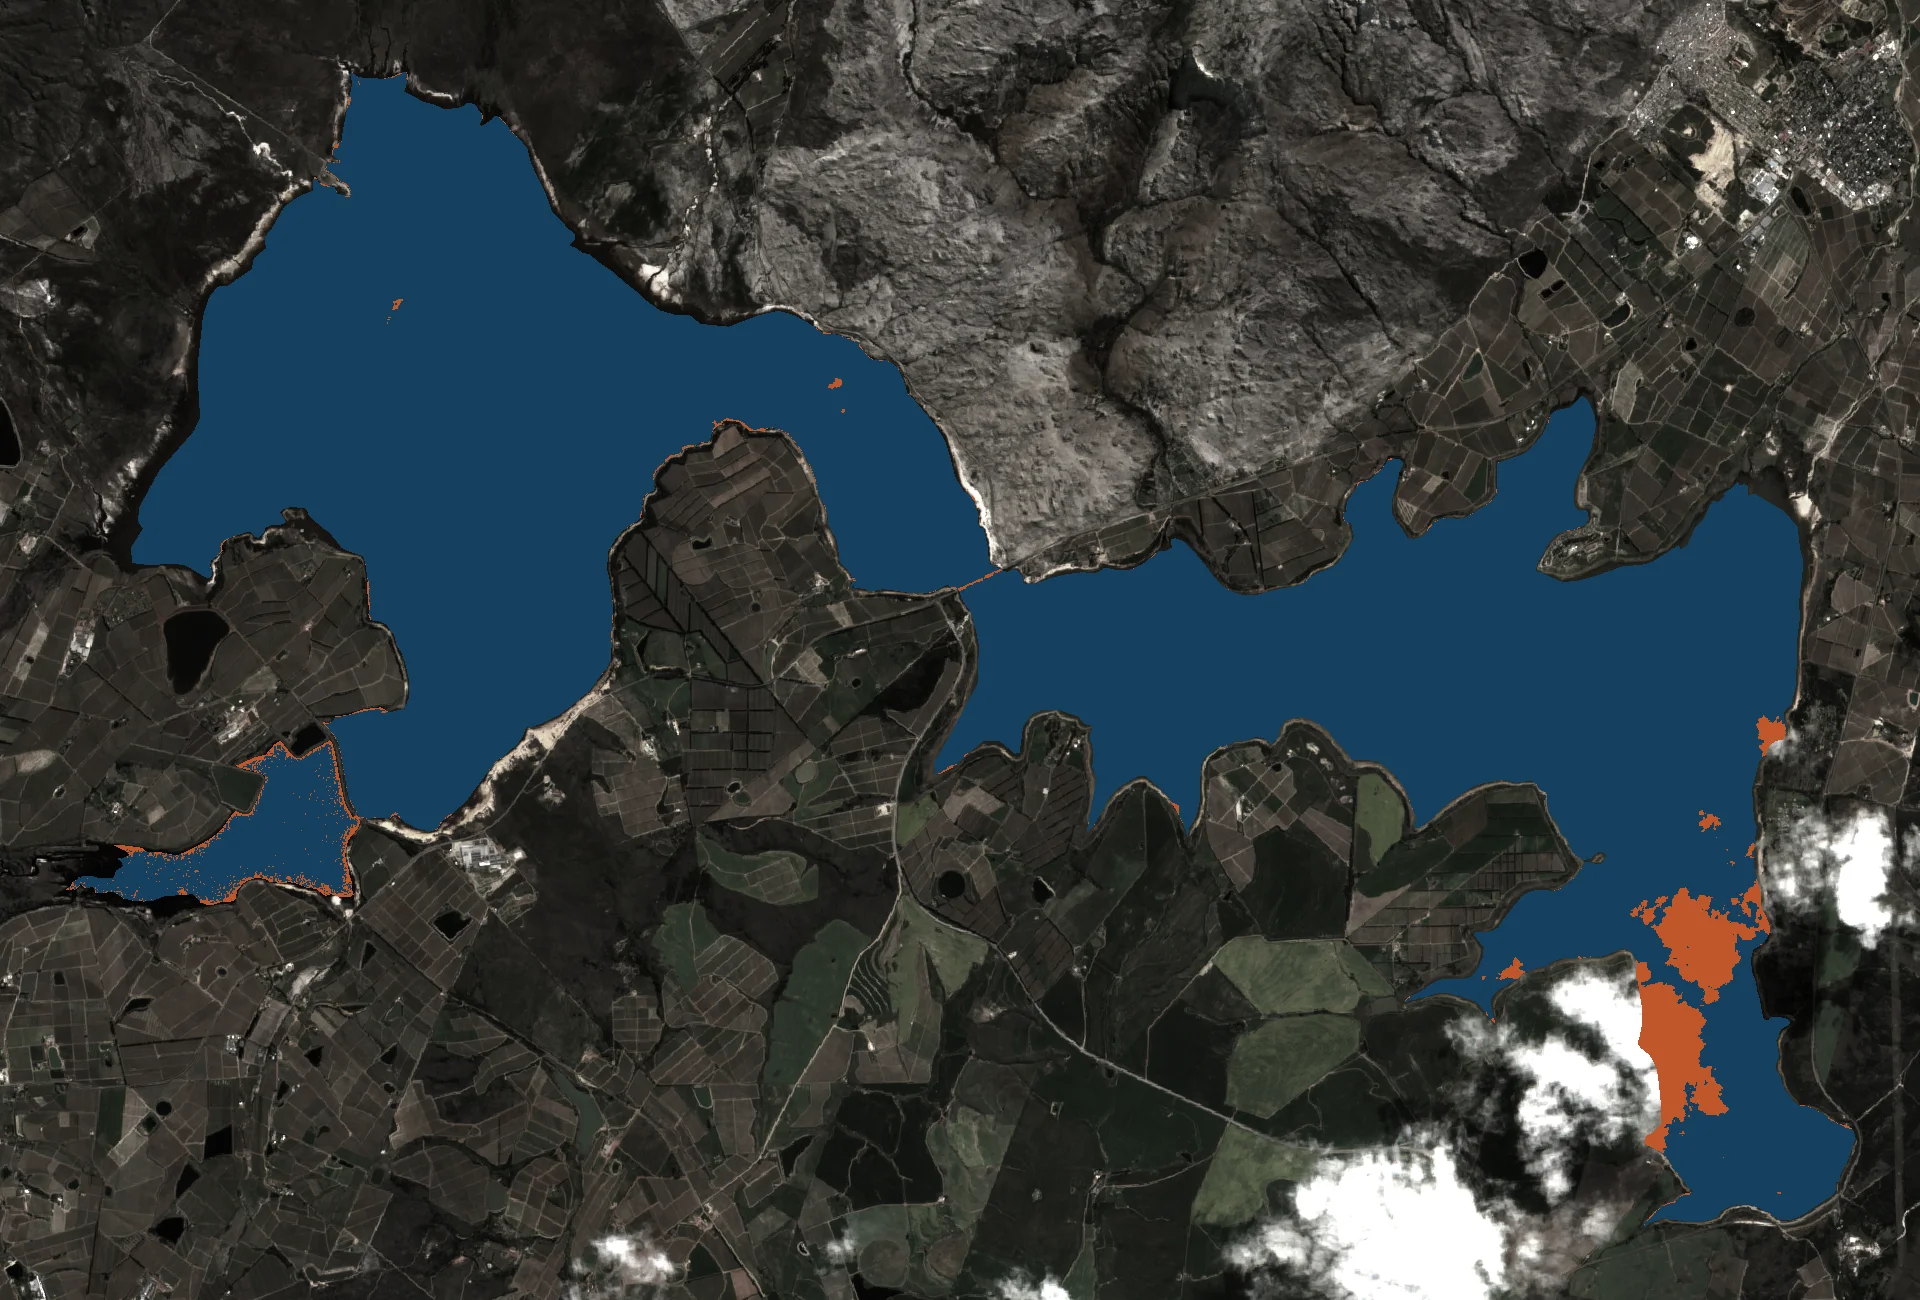
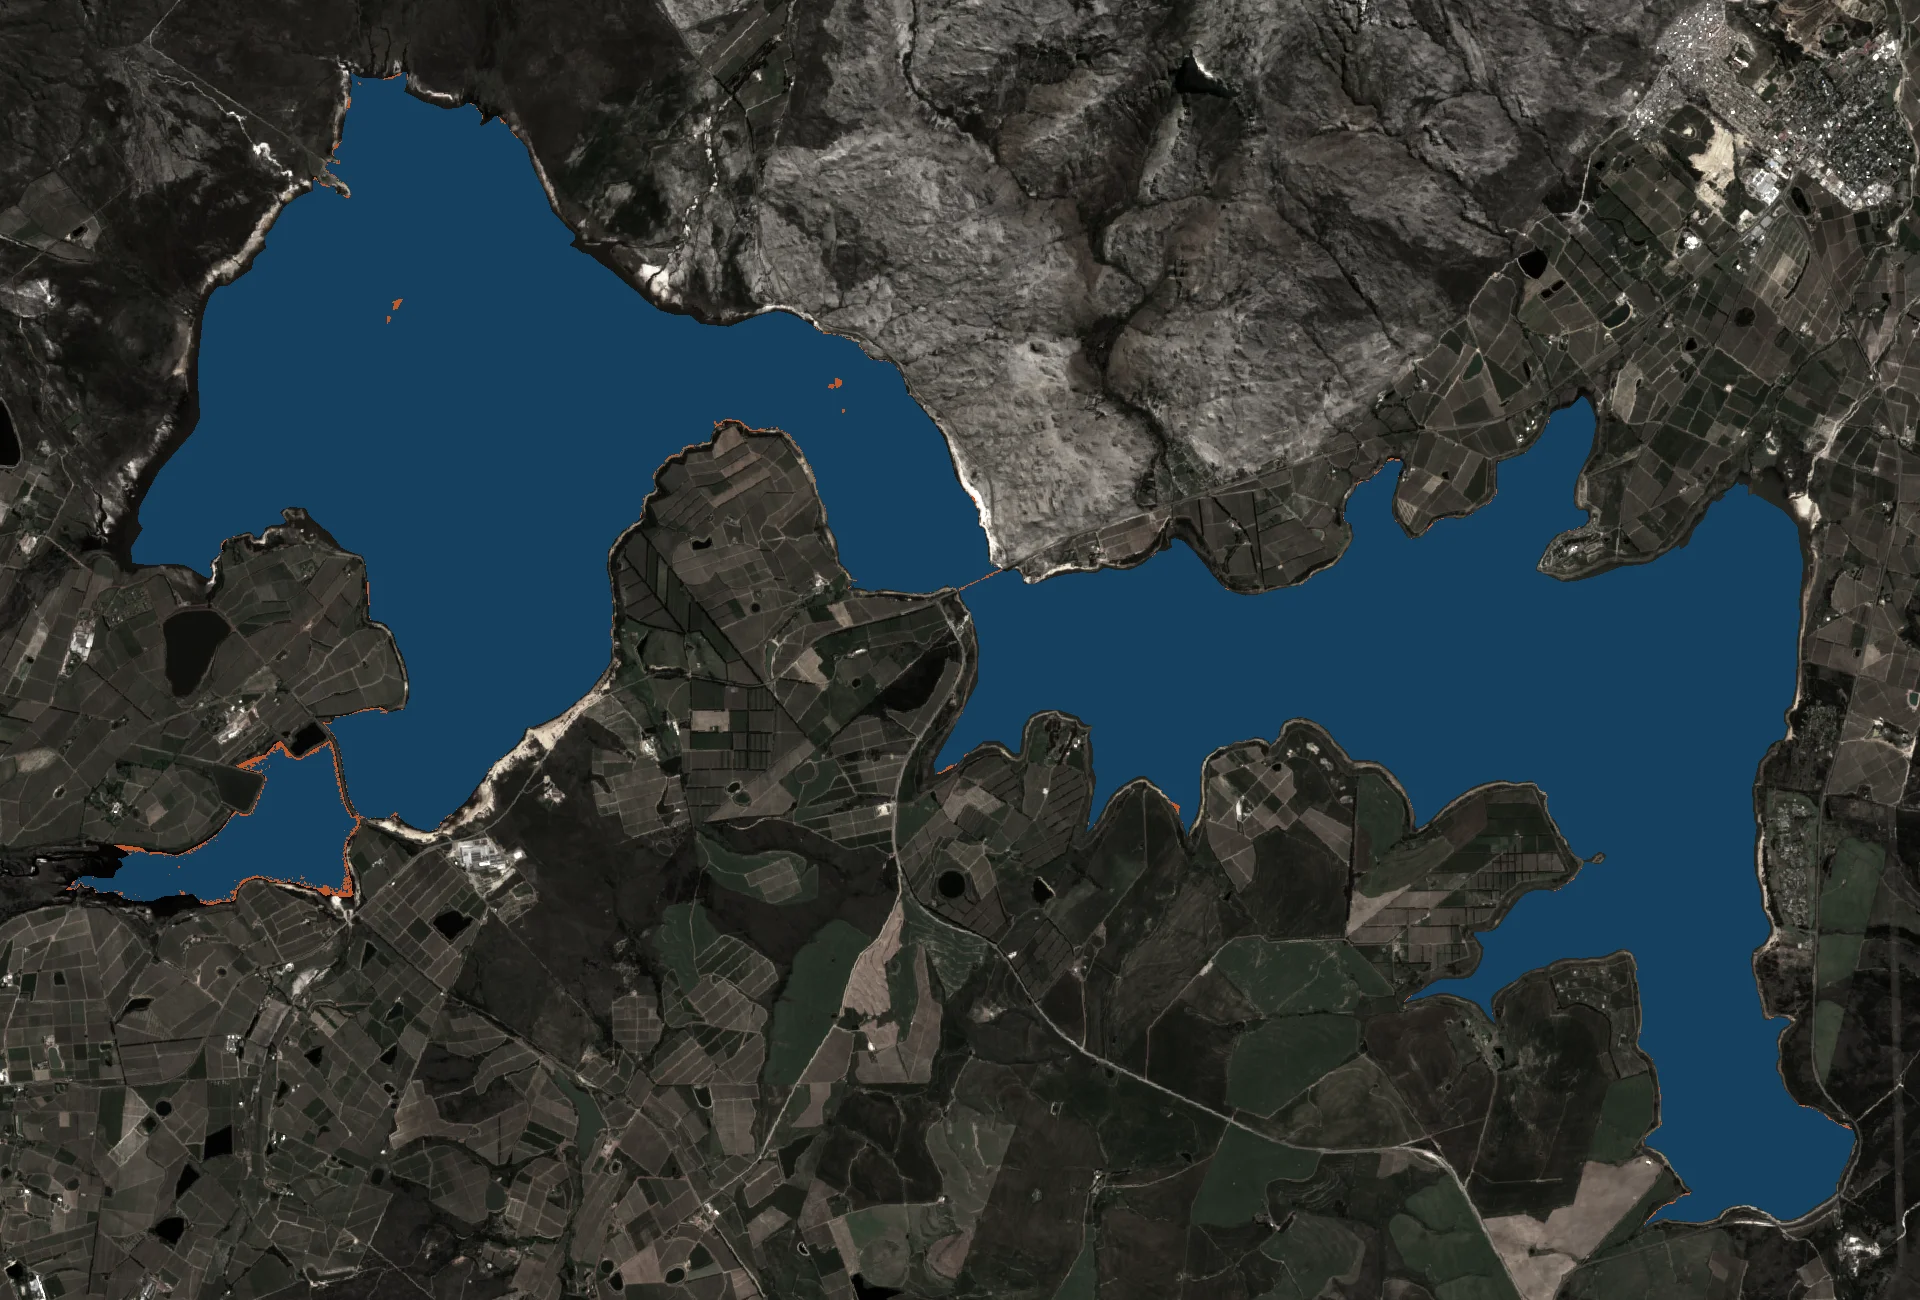
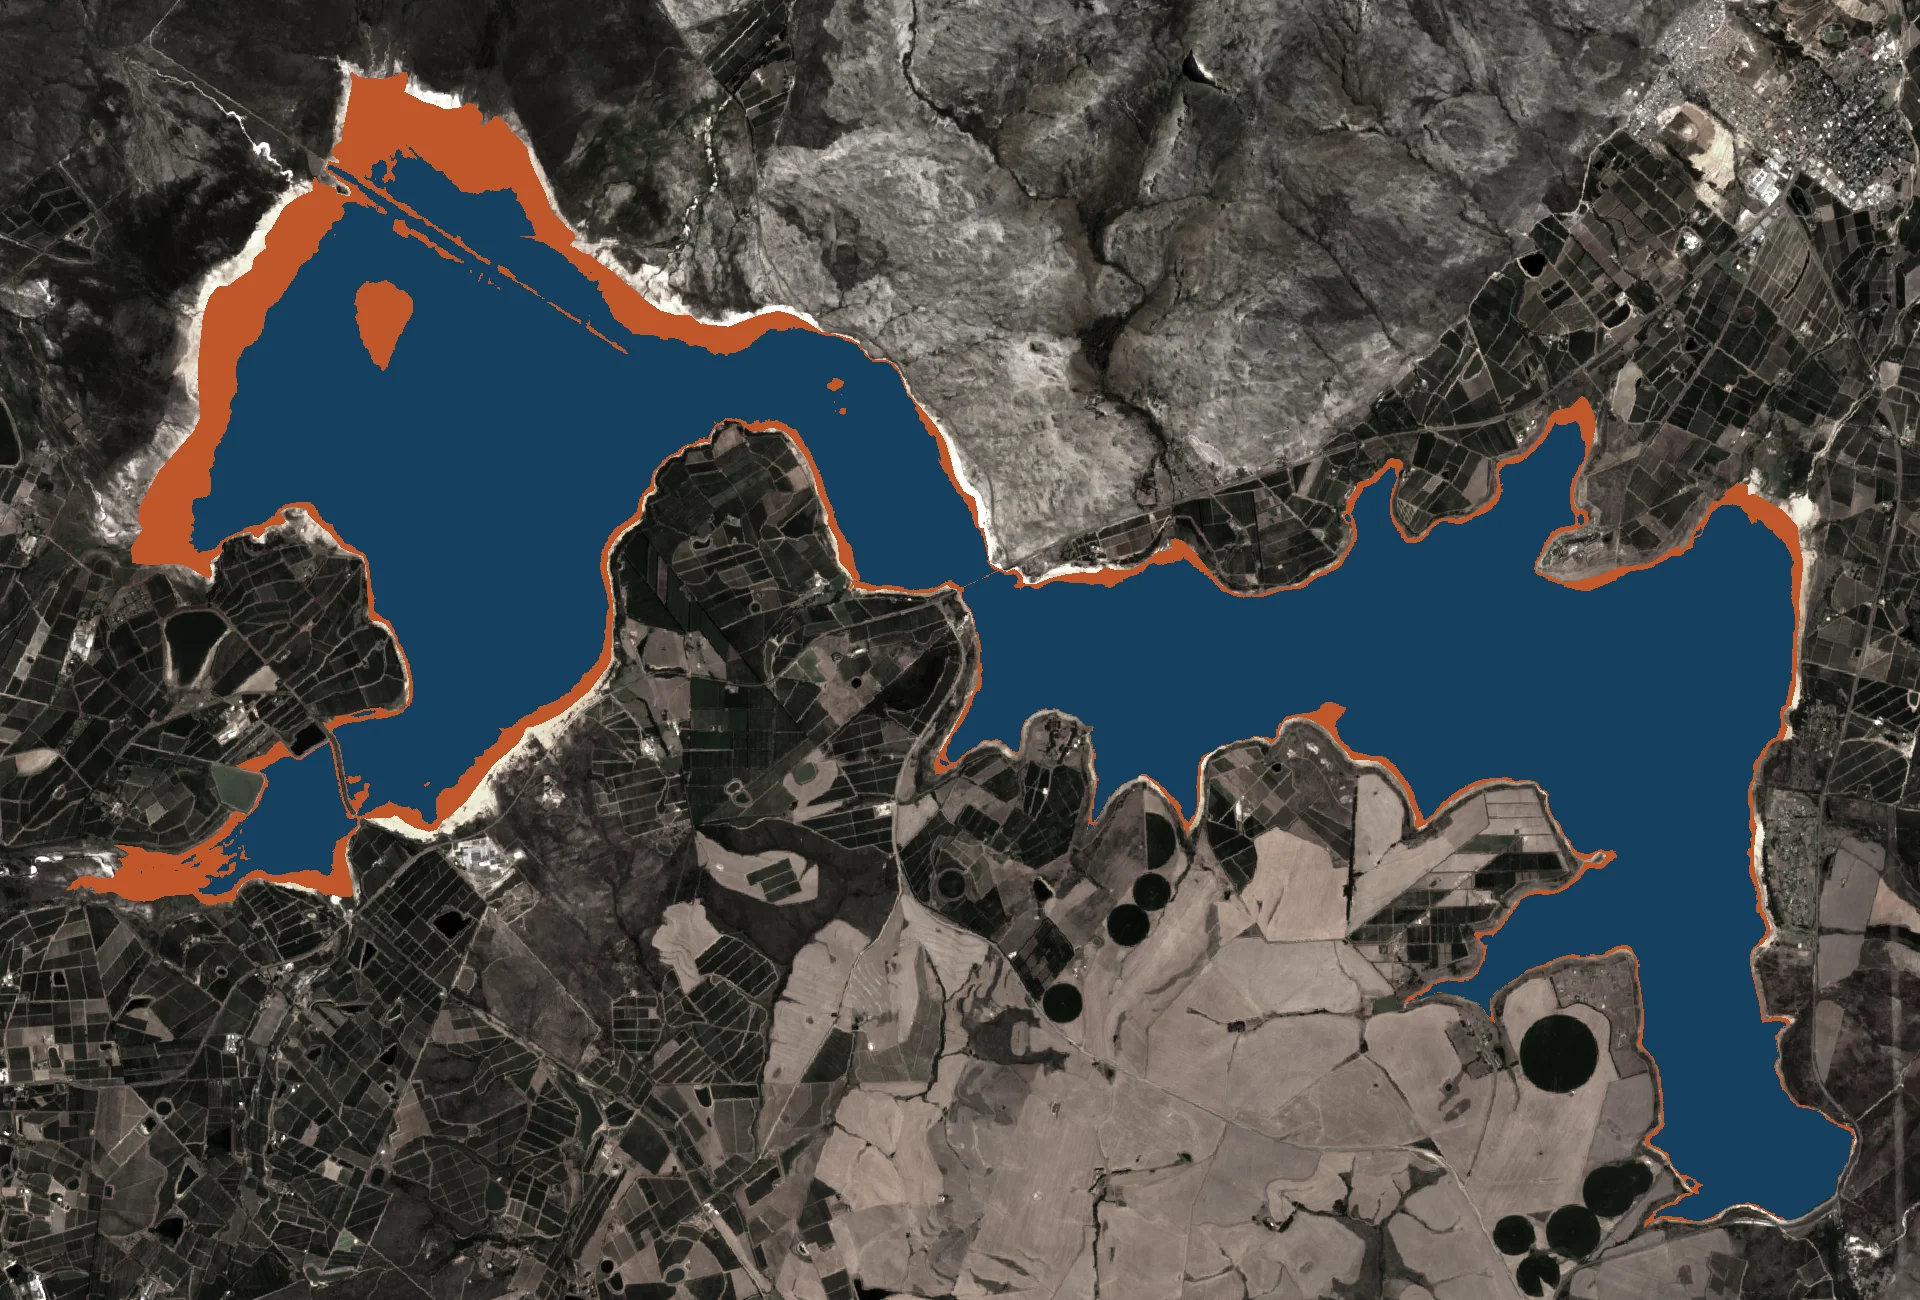
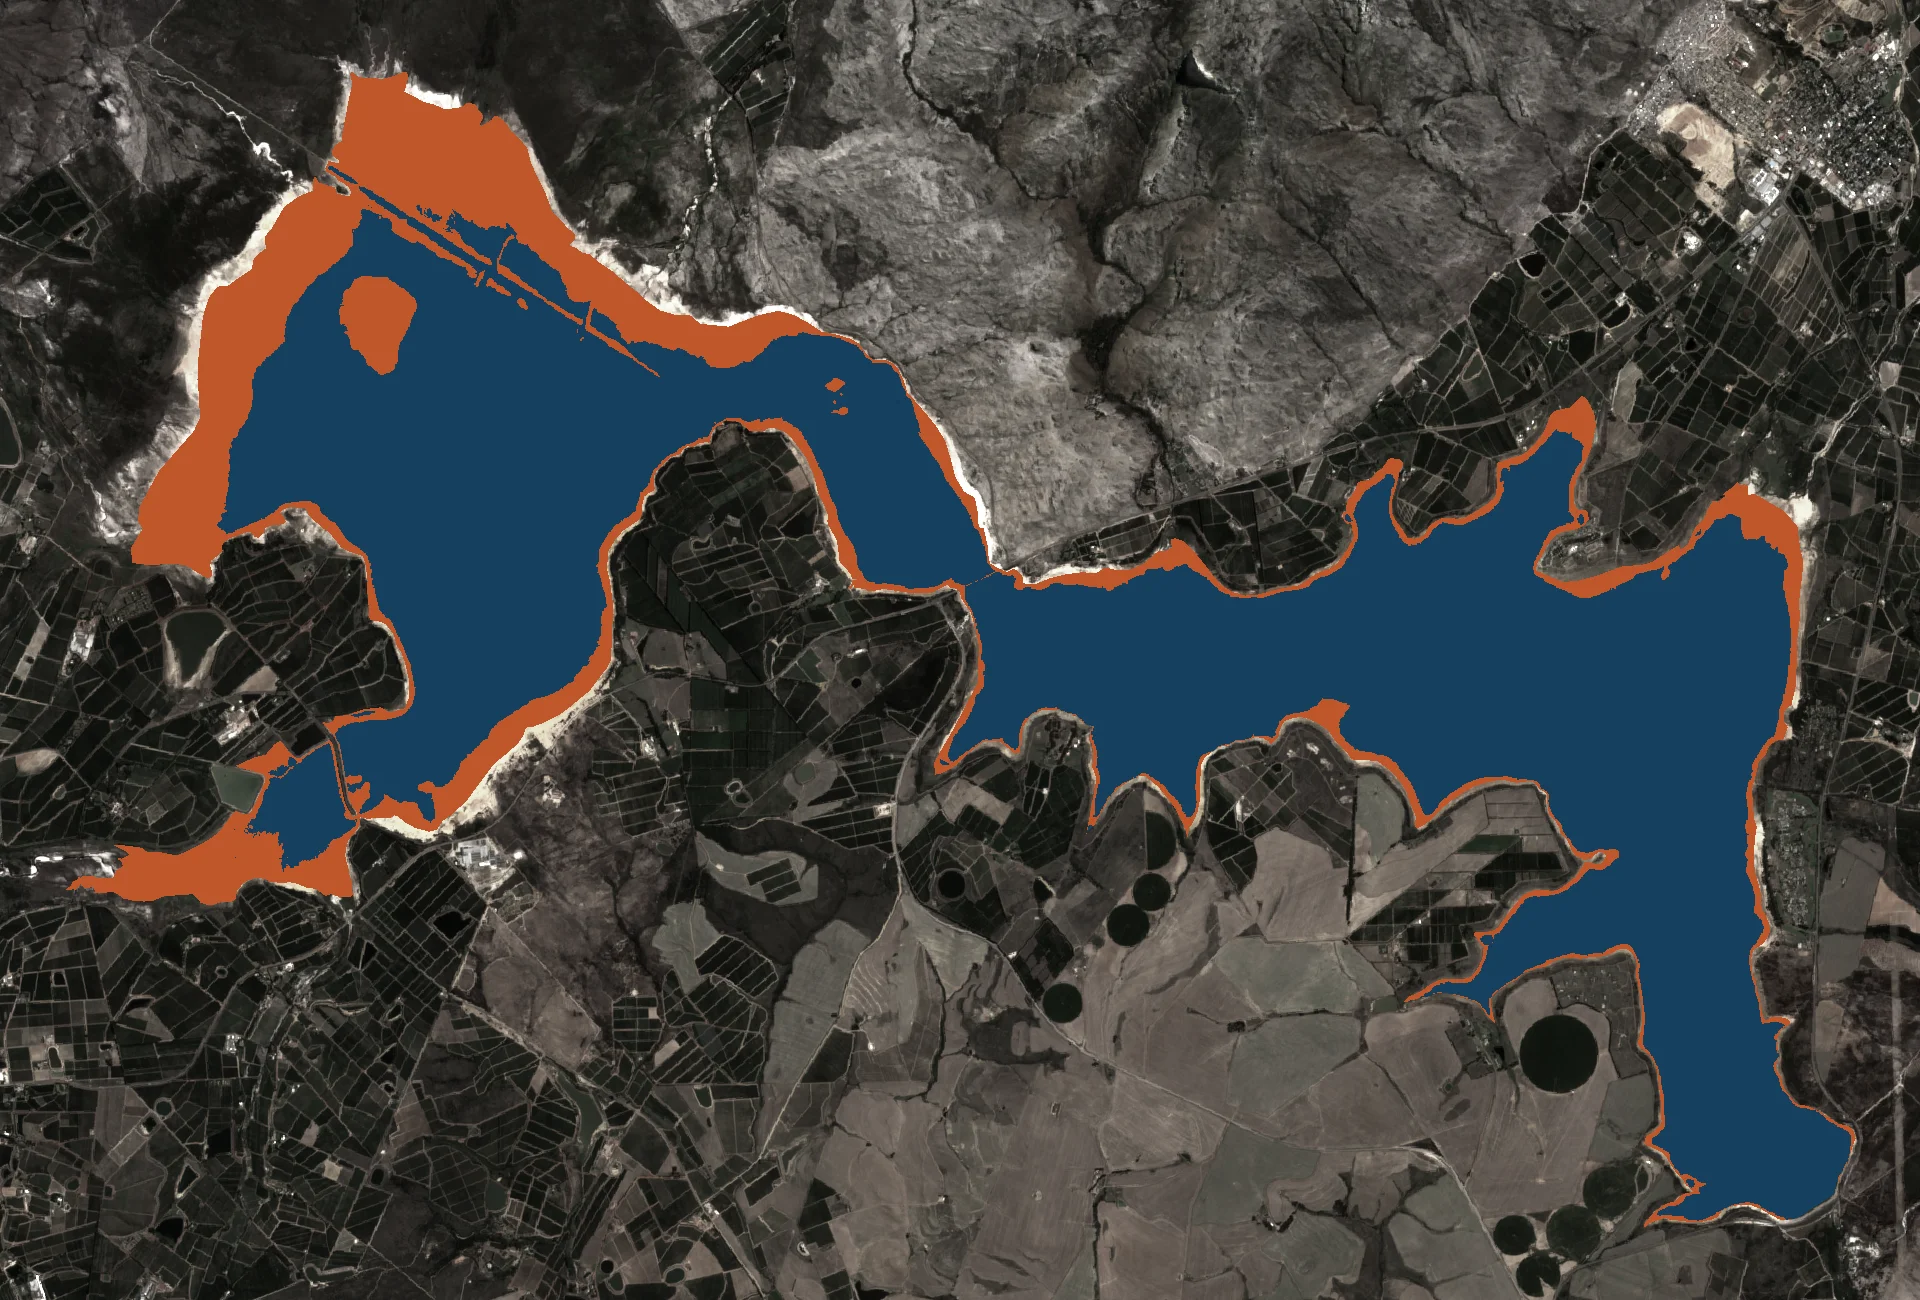
A year, flicker by flicker.
Monthly Sentinel-2 passes from 2025 through today. The water margin drifts in and out as the seasons turn.
Will the rain come?
Cape Town's reservoirs refill almost entirely between May and September. A dry winter is the single biggest predictor of next summer's restrictions — more than population, more than per-capita use. The 7-day forecast is running ahead of the long-term median for this catchment. A small relief, not yet a trend.
Use less than 100 L per person, per day.
That's the City's everyday target — about half a bath. During Level 6B in 2018 the limit was 50 L. The simplest wins: a 2-minute shower instead of a bath, a full dishwasher, and a brick in the toilet cistern.