Cape Town’s tap water starts as rain on mountains more than 100 kilometres east of the city. The cape town water catchment system, a chain of valleys, rivers, and fynbos-covered slopes, is all that separates four million people from a dry tap.
Stand on the roof of Cape Town’s main water treatment plant at Faure, east of the city, and look toward the horizon. The mountains in the distance, the Hawequas, the Franschhoek range, the slopes running toward Villiersdorp, are the actual source of the city’s water. Rain falls up there. It drains into rivers. The rivers feed the dams. The dams feed the taps.
The distance from mountain ridge to kitchen tap is about 100 kilometres and involves six dams, hundreds of kilometres of pipeline, and one of the most complex inter-basin transfer schemes in southern Africa. Most Capetonians never think about any of it.
Worth thinking about.
The mountains that matter
Most of Cape Town’s clean drinking water comes from catchments in the Boland and Groot Winterhoek mountain fynbos areas to the east and north-east of the city.
These are not famous mountains by global standards. The Groot Winterhoek peaks just above 2,000 metres. The Franschhoek and Hawequas ranges are lower. But what they lack in height they make up in rainfall. These mountainous areas often receive more than 2,000 mm per year, against as little as 300 mm in parts of the city.
The reason is simple physics. Most rain falls during winter storms caused by cold fronts. Moist air blown inland from the Atlantic is forced to rise over the mountains, cooling as it climbs until the moisture falls as rain. The Cape Town side of those mountains is relatively dry. The eastern and northern slopes, facing the cold fronts directly, soak.
The catchment area of the Boland Mountains feeds the Berg, Breede, and Riviersonderend rivers, and provides almost the entire water source for Cape Town.
Six dams, six catchments
The Western Cape Water Supply System (WCWSS) links six main dams through pipelines, tunnels, and distribution networks.
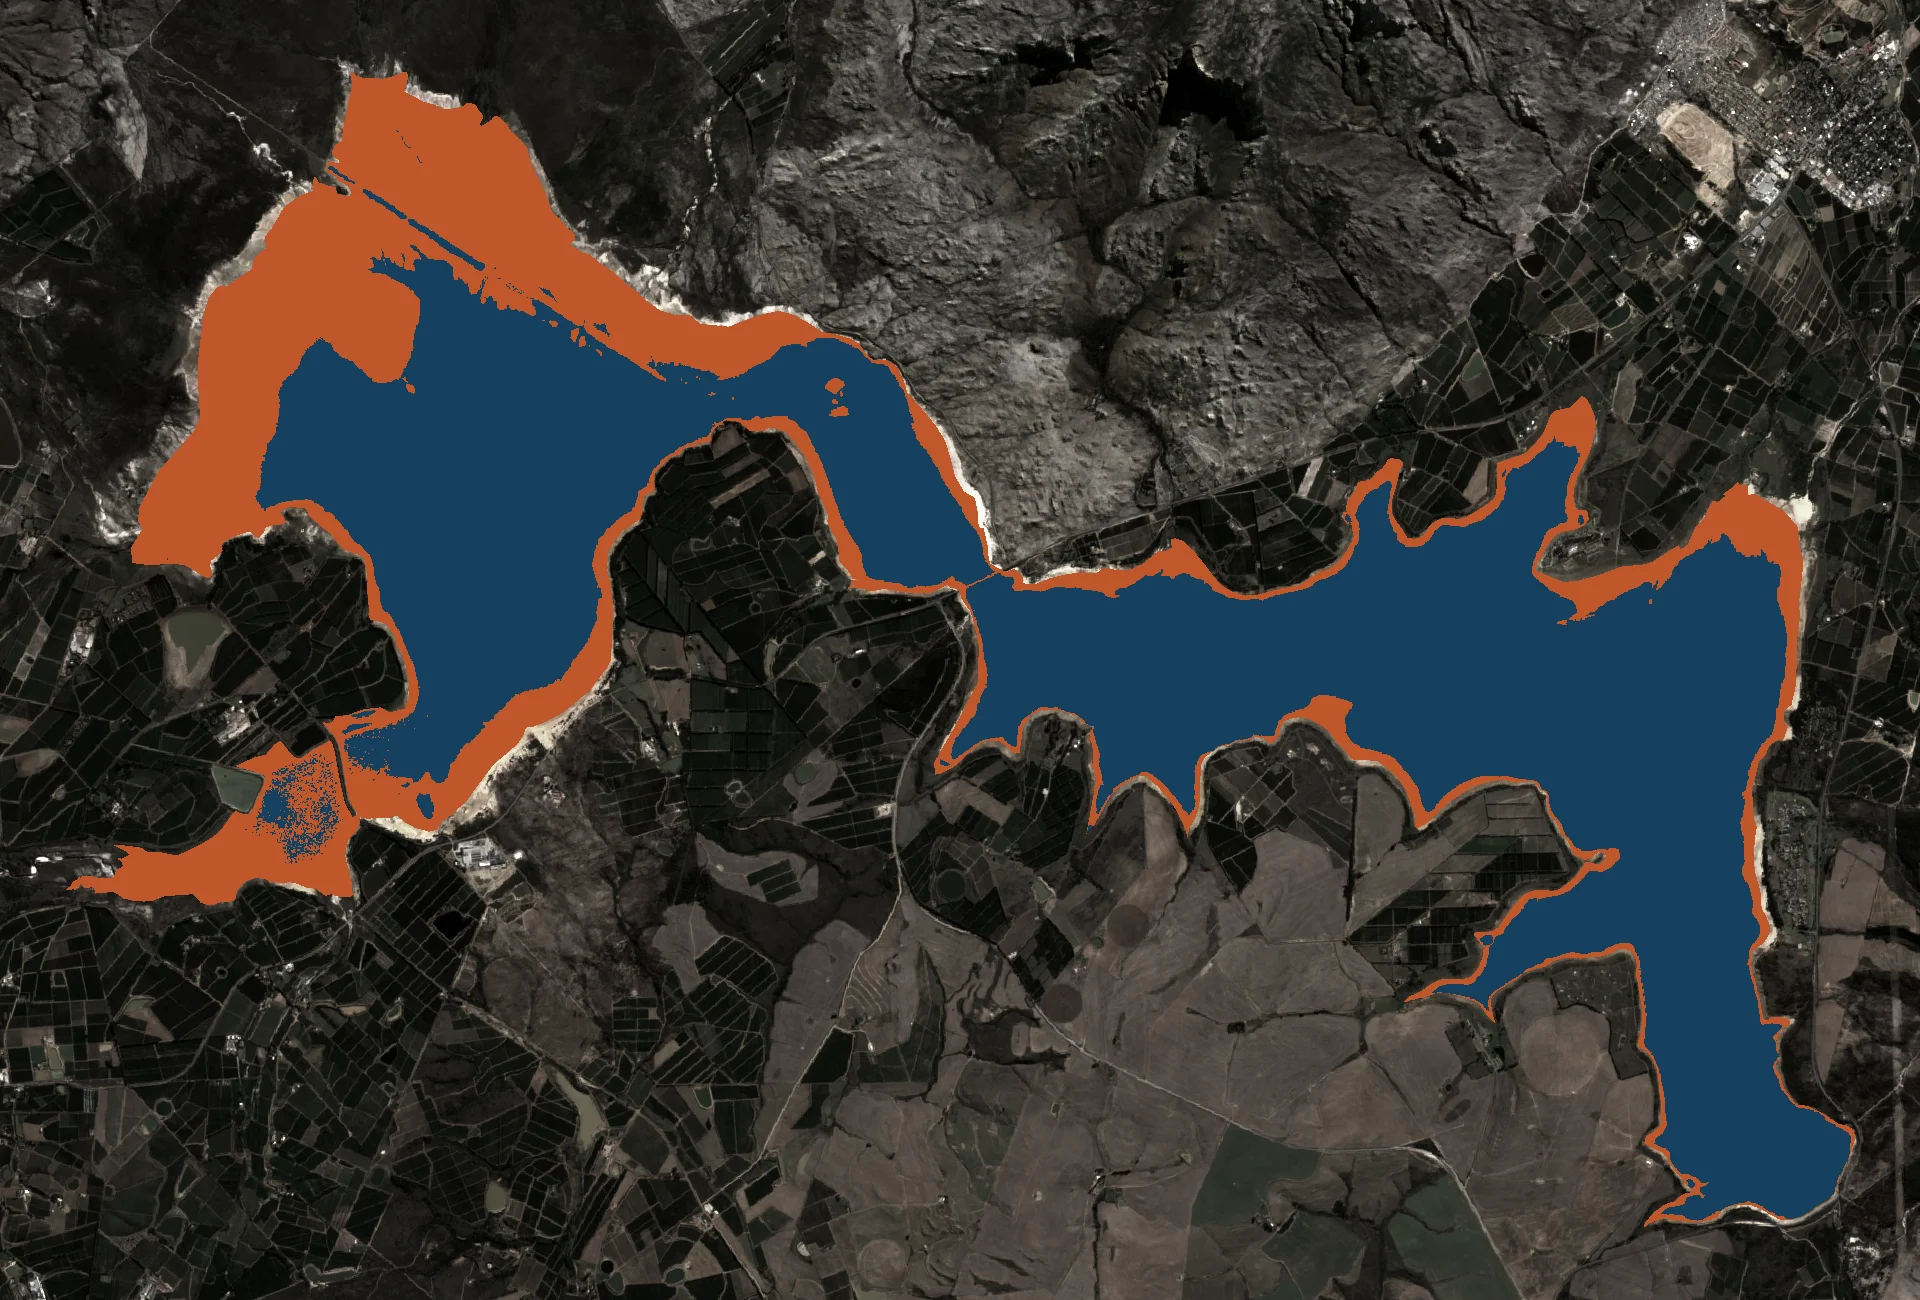
The six dams are not equal. Theewaterskloof, the largest dam in the WCWSS, has a capacity of 480 million cubic metres, about 41% of the water storage available to Cape Town. It sits on the Riviersonderend River near Villiersdorp, in a wide shallow bowl that fills from a catchment of around 500 km². In a good winter, the Riviersonderend delivers enough flow to push the whole system meaningfully upward. In a bad one, it doesn’t.
The other five dams work differently. Voëlvlei is an off-channel dam with a small natural catchment; it fills mainly from canal diversions — water drawn from the Klein Berg and Vier-en-Twintig rivers draining the Groot Winterhoek — as well as, more recently, from water pumped from the Berg River mainstem during peak winter flow. Berg River Dam, completed in 2009, was purpose-built to capture the Berg River’s winter flood pulse, the water that used to run straight to the sea. Wemmershoek catches rain off the Hawequas mountains in a smaller but deep and reliable catchment. The Steenbras dams above Gordon’s Bay are fed by the Steenbras River in the Hottentots Holland range and drain toward False Bay.
Cape Town uses approximately 64% of the WCWSS water; agriculture accounts for around 29%, with other urban areas taking the remaining 7%.
How orographic rain works
The technical word is orographic, rain caused by terrain forcing air upward. In the context of Cape Town’s water supply, it explains almost everything.
A cold front rolls in off the Atlantic, carrying moisture. Where the terrain is flat, the air stays low, the moisture stays in suspension, and the front passes with light drizzle. Where it hits a mountain wall, the air has nowhere to go but up. Rising air cools. Cool air holds less moisture. The moisture falls as rain, sometimes as snow above 1,500 metres.
The eastern slopes of the Hottentots Holland, the Franschhoek range, and the Groot Winterhoek face the fronts at the right angle. They are, effectively, rain interceptors, positioned to strip moisture from systems that would otherwise deliver little to the catchments.
This is also why drought hits so hard. When the fronts track too far north or south, or arrive weakened, the interception still happens, just with less moisture to capture. The difference between a wet winter and a drought winter can be as little as the preferred track of Atlantic storm systems shifting by a few degrees of latitude. The weather station at Cape Town airport recorded well below-normal rainfall by late 2015, and progressively less in the following two years. By late 2017, only a fraction of the normal annual total had fallen. The catchments reflected each year’s shortfall directly in the dam gauges.
Fynbos and the water supply
The Boland and Groot Winterhoek catchments are covered in fynbos, the diverse shrubland unique to the Cape Floristic Region. It is also an unusually efficient water producer for its climate type.
Fynbos has shallow root systems that do not penetrate far into the rocky sandstone substrate. Rain that lands on fynbos-covered slopes moves relatively quickly into streams and rivers rather than being locked in deep root systems. The combination of high rainfall and shallow soil creates high runoff ratios, meaning a large proportion of what falls actually reaches the dams.
The relationship between fynbos cover and catchment yield is well established in South African hydrology. Much of the Groot Winterhoek range remains in a natural state, and a large portion is formally protected — a fact with direct consequences for how much water flows into the Berg River system downstream.
The fynbos connection also explains why ecologists and water engineers share the same conversations about these mountains.
Invasive trees: the silent drain
The biggest single threat to catchment yield is not drought. It is trees, specifically invasive alien trees such as pine, eucalyptus, and wattle, which have been spreading through the Cape Fold mountains for over a century.
The problem is roots. Invasive trees have deep, extensive root systems that draw water from the soil year-round, including in summer when the catchments are already losing water to evaporation. Fynbos, during its dry-summer dormancy, stops demanding water. An invasive pine does not.
Studies of Western Cape catchments have found that dense invasive stands can reduce river flows by 30% or more compared to an equivalent area of natural fynbos. For the WCWSS, this translates to a real reduction in the volume that reaches the dams each winter. Eradicating and managing invasive alien plants within Western Cape catchments has been identified as the most effective way to increase water supply within the region.
The Groot Winterhoek’s protected status, covering a large portion of the range, helps hold the invasive pressure back. The Working for Water programme, a national government initiative, has been clearing invasive species from priority catchments since the 1990s. It remains one of the most cost-effective water-augmentation strategies available to the Western Cape.
What the catchments look like right now
As of 11 August 2026, the combined WCWSS sits at 78.3%, a healthy position for mid-August, though 11 percentage points below the same date last year. The individual dams tell a varied story.
Wemmershoek, fed by the reliable Hawequas catchment, is at 98.1%. Berg River is at 92.3%. Steenbras Upper sits at 96.9%. These are the deeper, more reliable dams, and their high levels reflect a winter that, while not exceptional, has been consistent.
Theewaterskloof, the system’s bellwether, is at 78.4%, in line with the combined average, which makes sense given its dominance of total capacity. Voëlvlei, dependent on canal and pump diversions rather than its own small natural catchment, sits at 61.5%. Steenbras Lower is at 53.6%.
The 7-day catchment forecast shows around 19 mm expected, close to the climatological average of 22.5 mm for this period. A wet weekend is looking possible. In mid-August, any additional rainfall still goes into the dams; the dry-season drawdown doesn’t begin in earnest until October.
For now, the catchments are doing their work. The fynbos is wet. The rivers are running. The question the dams are always answering is the same one they answer every April: was there enough winter rain? Watching the combined dam level in that month, before the dry season closes the window, is the simplest proxy for how the catchments performed.