Cape Town gets its water from six dams scattered across mountain ranges up to 120 kilometres east of the city. Tracing the Cape Town water supply system means following rain from a fynbos ridge in the Boland all the way to a tap in Khayelitsha or Constantia.
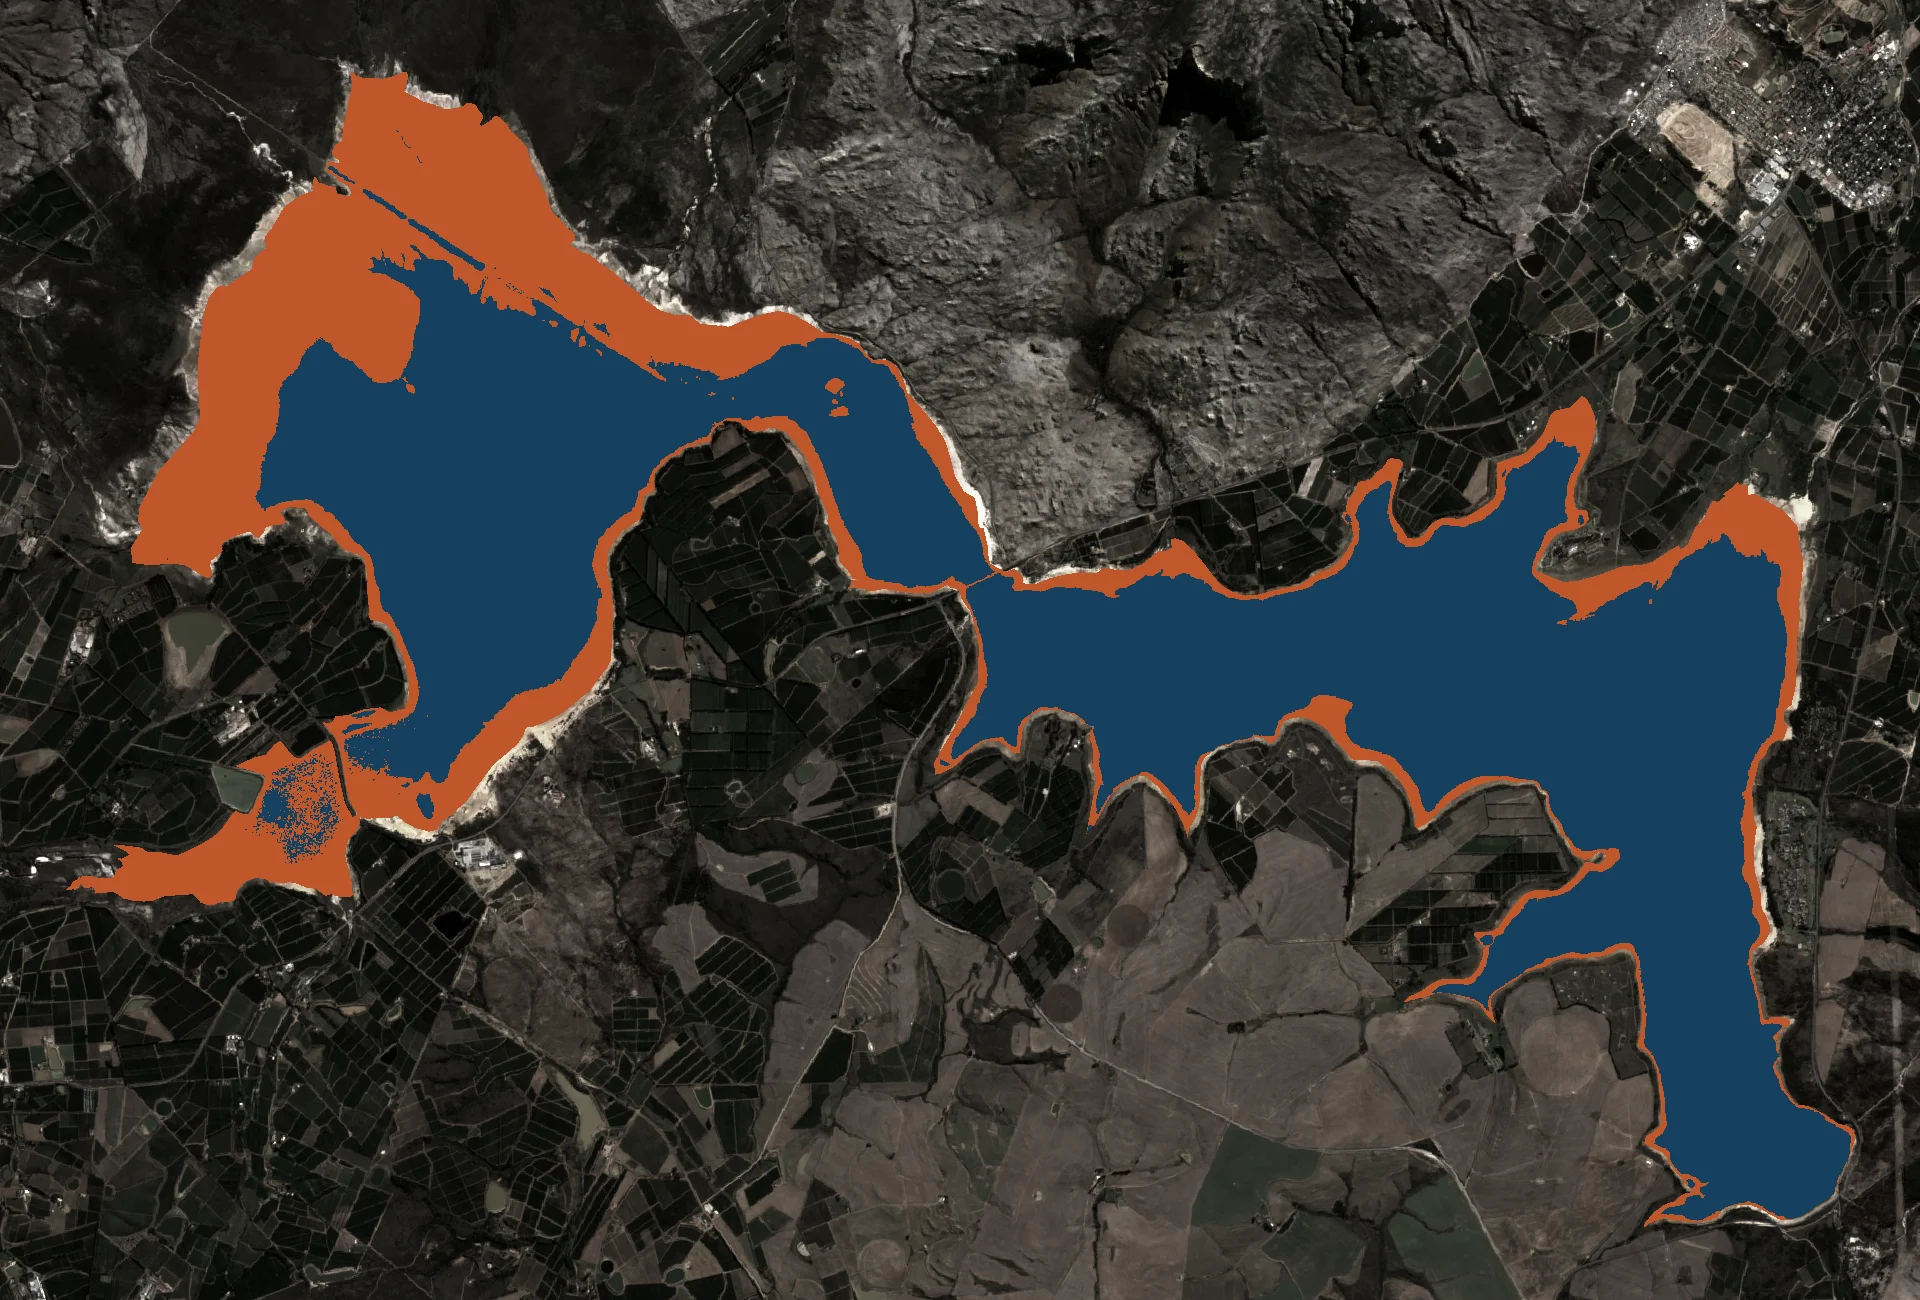
On a wet June night in the Hottentots Holland Mountains, rain that falls on a sandstone ridge at 1,500 metres has several hours of travelling to do before it becomes drinking water. It soaks into fynbos-covered slopes, trickles into streams, passes through intake works, moves through tunnels bored through mountain rock, and eventually reaches one of four treatment plants ringing the Cape Town metropolitan area. The whole journey can take days. The Western Cape Water Supply System (WCWSS) is the infrastructure that makes it happen.
The system is not six independent reservoirs each feeding a different suburb. It is a single interlocked network of dams, tunnels, canals and pipelines that moves water between catchments depending on where rain fell and where demand sits. As of August 2026 it holds about 78 percent of its total capacity — comfortably above the danger zone, though about 11 percentage points below the same week last year.
Where the rain actually falls
Cape Town has a Mediterranean climate, which concentrates almost all its useful rainfall into three months: May, June, and July. The rest of the year is an afterthought.
The six dams sit in different mountain ranges, and each range has its own rainfall pattern. Theewaterskloof, the largest dam by far, occupies the upper Sonderend River valley behind the Hottentots Holland range near Villiersdorp. Its catchment covers about 500 square kilometres of high fynbos terrain that receives some of the heaviest rainfall in the Western Cape — sometimes more than 2,000 mm per year on the upper plateau.
The Berg River Dam, the newest of the six, was inaugurated in 2009 and sits in the Franschhoek Mountains, impounding the upper Berg River. Wemmershoek Dam is nearby, on the Wemmershoek River above Franschhoek. The Steenbras pair — upper and lower — catch water draining off the Hottentots Holland range above Gordons Bay, on the other side of Sir Lowry’s Pass from Theewaterskloof. Voelvlei, the second-largest dam by capacity, sits in a natural depression near Wolseley with a small direct catchment and is fed mainly by a system of canals drawing from the Klein Berg River and the Leeu River in the Groot Winterhoek range.
The six dams and how much they hold
Theewaterskloof dominates. With a capacity of around 480,000 megalitres, it holds more than half the system’s total storage on its own. When it drops, the combined percentage follows almost immediately. When it recovers, so does the system reading you see on this site each Monday.
Voelvlei is second, at roughly 168,000 megalitres. Berg River Dam holds about 130,000 megalitres. After that the numbers fall away: Wemmershoek at about 59,000, Steenbras Lower at about 36,000, and Steenbras Upper smaller still, its capacity largely reserved for the Steenbras pumped-storage hydroelectric scheme that supplements Cape Town’s electricity grid during peak demand.
Together those six reservoirs give the system a total capacity of around 898,000 megalitres. Cape Town currently draws about 874 megalitres a day from the network — 149 litres per person per day. A full system, at that consumption rate, would theoretically last about three years. In practice, the dams never stay full: autumn demand and evaporation erode them steadily from October, and the cycle starts again the following May.
How water moves between dams
The system’s engineering is what makes it resilient. Water does not simply flow downhill from each dam to the nearest suburb. It is pumped, tunnelled and piped across mountain ranges.
The largest transfer mechanism is the Riviersonderend-Berg River Government Water Scheme, an inter-basin transfer that moves water between the Sonderend catchment (Theewaterskloof) and the Berg River catchment. A tunnel cuts through the Hottentots Holland Mountains and links Theewaterskloof to the Faure Water Treatment Works near Strand, which then feeds the city’s bulk distribution network westward. A second tunnel connects the upper Steenbras reservoir to the lower one, and from there to the Faure works. Wemmershoek connects to the Faure system via its own pipeline. Voelvlei feeds the Blackheath treatment works on the Cape Flats, as well as agricultural users along the Berg River.
The result is that a litre of water that fell on the Wemmershoek River above Franschhoek might be treated at Faure, sit in a service reservoir in Bellville, and flow out of a communal tap on the Cape Flats days later. The system was designed this way deliberately: if one catchment has a poor winter, water can be pulled from another.
What invasive plants steal from the catchments
There is a hidden drain on the system that does not appear in the weekly dam-level report: invasive alien plants. Pines, wattles and hakeas spread through mountain catchments and use far more water than indigenous fynbos. They have deeper roots and larger leaf areas, and they intercept rain before it can run off into streams.
Research presented to the Department of Water and Sanitation finds that clearing invasive aliens from Western Cape catchments is one of the most cost-effective water augmentation measures available — cheaper per megalitre than building new infrastructure. The City and the DWS both fund Working for Water programmes in the WCWSS catchments. Every hectare cleared returns some fraction of rainfall to the stream network rather than to a pine tree’s transpiration.
It is unglamorous work, which is probably why it rarely features in conversations about Cape Town’s water future. But the catchment is the top of the system. What happens there determines what arrives at Theewaterskloof six weeks later.
What the current levels mean
As of 11 August 2026, the combined system sits at 78.3 percent. That is the number the City of Cape Town dam levels dashboard reports each week, and it is a weighted aggregate: total megalitres stored divided by total capacity across all six dams.
This week’s 78.3 percent compares to 89.3 percent on the same week last year. The gap reflects a winter that has been drier than normal across most catchments. The 7-day catchment forecast shows only about 1.6 mm of rain expected, against a climatological average of 22.7 mm for this time of year. The system remains well above the 13.5 percent threshold the Day Zero predictor uses as its operational cut-off, but the trajectory into the dry season matters.
By October, when the winter rains have stopped, the dams typically hit their annual peak and then start a six-month decline. The end-of-summer low, usually reached in April or May, is the number that concentrates attention. A summer of above-average demand or a dry spring can shift that trough by five to ten percentage points in either direction.
A system designed for yesterday’s climate
The WCWSS was built for a reliable Mediterranean climate: wet winters, dry summers, predictable mountain snowfall amplifying spring inflows. That climate is shifting.
A World Weather Attribution study on the 2015-2017 drought found that climate change had made a drought of that severity roughly three times more likely compared to pre-industrial conditions. The Boland mountain catchments that supply most of the system’s water are expected to receive less reliable winter rainfall as the century progresses.
The City’s response has two parts. On the demand side, per-capita consumption dropped from over 200 litres a day during the 2017-2018 drought emergency and has been held at about 149 litres since. On the supply side, the New Water Programme is adding desalination, water reuse and aquifer extraction — sources that do not depend on rain falling on a specific set of mountain ranges in May, June and July. Read more about Cape Town’s desalination plants for the supply-side picture.
For now, the system still relies on those mountain catchments for most of its water. Watching the weekly dam level through winter, and particularly through the dry stretch from November to April, is still the simplest measure of whether Cape Town’s water supply is where it needs to be.