Theewaterskloof Dam is the single largest piece of Cape Town’s water supply — a 480 Mm3 reservoir near Villiersdorp that the city nearly drained dry in 2018, and whose theewaterskloof dam level still drives decisions for the entire Western Cape Water Supply System.
On 4 May 2026, Theewaterskloof held 47.7% of its 480 Mm3 capacity. The same week in 2025 it was at about 59%. That gap, around 11 percentage points, is the kind of shortfall that, compounded over a second dry winter, historically starts the conversation about restrictions.
Winter has arrived on schedule. The seven-day catchment forecast as of this week shows 128 mm of rain against a climatological average closer to 7 mm, nearly nineteen times the norm. If even half of that lands on the mountains above Villiersdorp, the dam will recover quickly. May and June are the months that do the work.
The dam that Cape Town runs on
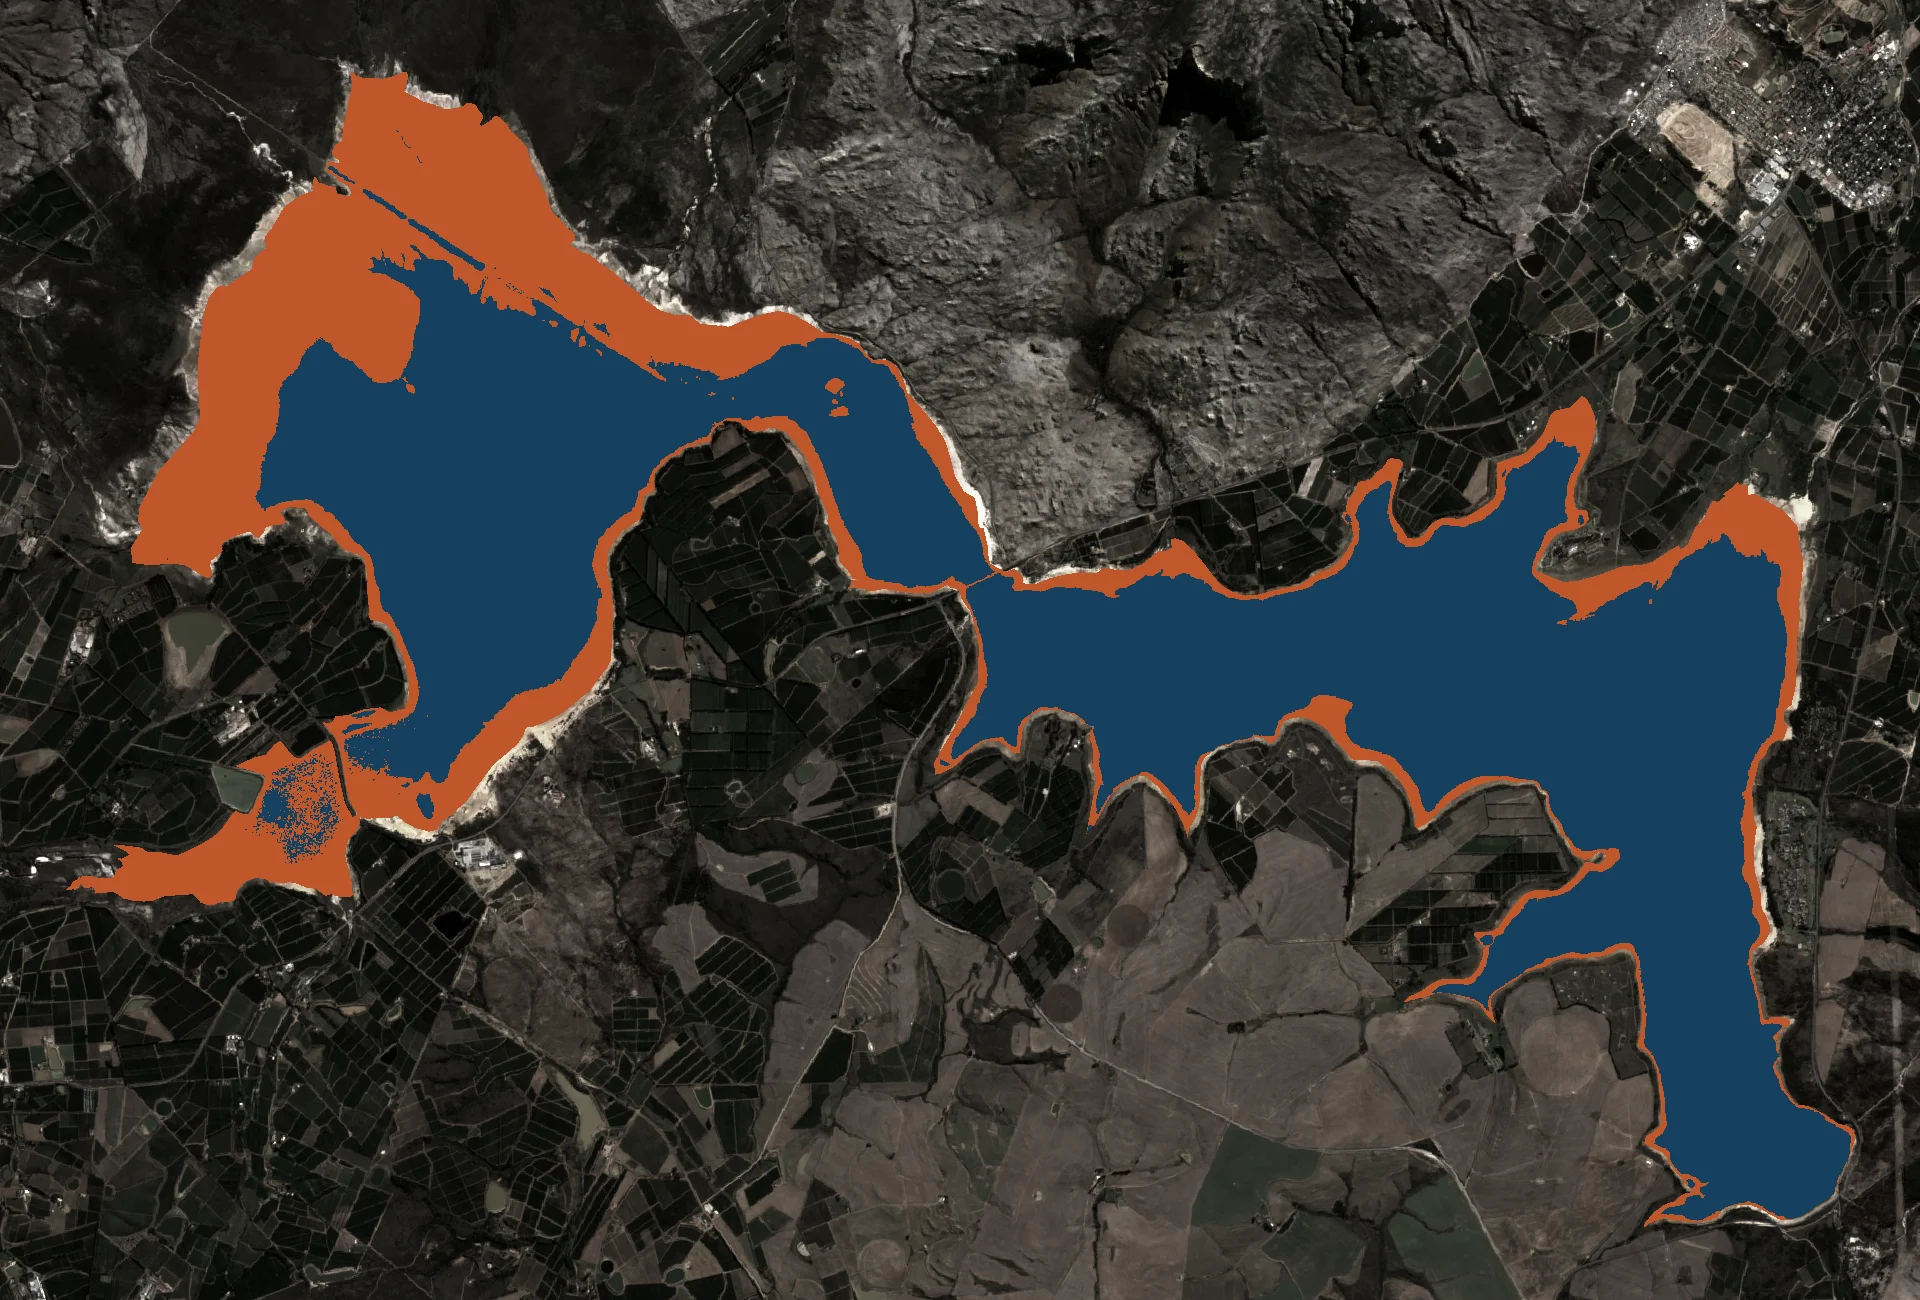
Theewaterskloof Dam sits on the Sonderend River in the Overberg, roughly 100 kilometres east of Cape Town. Completed in the late 1970s, it was built as the central reservoir for the Riviersonderend-Berg River transfer scheme, a system designed to link two catchments and give Cape Town a buffer against dry winters.
The dam’s earth-fill wall is 646 metres long and 35 metres high. Its capacity, 480 Mm3, is the largest of any dam in the Western Cape Water Supply System and is about 41% of the total storage available to the city. The other five dams, Voelvlei, Berg River, Wemmershoek, Steenbras Upper and Steenbras Lower, share the remaining 59%.
When Theewaterskloof is healthy, the whole system holds up. When it drops, the other five can only partly compensate.
How the water actually gets to Cape Town
Water leaves Theewaterskloof via the Franschhoek Tunnel, a conduit bored through the Franschhoek Mountains that feeds into the Berg River catchment and ultimately into Cape Town’s treatment plants. The tunnel can also operate in reverse, pushing surplus Berg River water back into Theewaterskloof during wet winters.
That two-way design gave engineers flexibility during the 2017-2018 crisis, but there is a hard floor. The last 10% of the dam’s storage sits too shallow and silt-heavy to draw cleanly. Operational dead storage means the effective usable capacity is closer to 432 Mm3 than 480.
This is why the City set a Day Zero trigger at 13.5% of combined system storage, not zero. Below that level, the bottom of Theewaterskloof becomes effectively unreachable with conventional intake infrastructure.
Three dry winters and a near-miss
Between 2015 and 2017, the Cape’s winter rainfall failed three times in succession. Combined storage entered May 2014 at 72% and kept sliding. By mid-2017 the whole system had fallen to around 28%. By the end of the 2017 dry season, Theewaterskloof itself had fallen to 12.9% — well into the danger zone.
A single June storm in 2017 pushed the level briefly to 15%, but overall rainfall that year remained far below average. By early 2018, the dam was near its floor again, and the City had put every household in Cape Town on a 50-litre daily limit for everything: drinking, cooking, bathing, the toilet.
The Day Zero crisis was averted by demand, not rain. Per-capita consumption fell from roughly 200 litres a day in 2015 to under 100 litres by mid-2018, a reduction that bought the system the margin it needed to reach the winter rains. For more on how that played out across different parts of the city, the Cape Town drought case study has the full data picture.
The recovery: from 12.9% to full
The winters of 2019 and 2020 were both wetter than average. Theewaterskloof reached 100% of capacity in 2020, the first time in six years the dam had been full.
That recovery came from rain, not from the demand side alone, but the city’s lower consumption floor meant the same amount of rain went further. Cape Town entered the 2020 winter with a smaller debt to repay.
The combined system level has stayed well above the danger zone since then. As of the report dated 4 May 2026, the six-dam system sits at 48.3%, up one percentage point from the previous week but about 11.6 points below the same time last year. Theewaterskloof’s 47.7% is close to the system average.
Where the level sits right now
The theewaterskloof dam level today is 47.7%. A year ago it was closer to 59%. The drop reflects a drier-than-average autumn rather than any structural problem with the catchment.
For context, the city’s current demand is around 874 megalitres a day, about 149 litres per person per day. That is well below the pre-drought figure of roughly 200 litres, and well above the 50-litre emergency ceiling from 2018, so the system is operating in a sustainable range.
The Day Zero predictor uses the 13.5% combined storage threshold to estimate how far the system is from crisis. At 48.3%, the margin is wide.
What the next few months will bring
May through July will determine the year. The Cape’s mountain catchments receive most of their annual rainfall in those three months, driven by cold fronts off the Atlantic. If the fronts arrive deep and wet, as the current forecast suggests, Theewaterskloof will recover to 60-70% before the dry season begins. If they are shallow and brief, the city starts next summer with less room.
Capetonians have learned to read the dam the way other cities read weather maps. Theewaterskloof’s weekly movement in May and June is the clearest single indicator of what kind of summer lies ahead.
The current level and the combined system percentage update every week. The live data is on the homepage, and the predictor shows what a wet or dry winter does to the Day Zero risk curve.
For now, the dam is filling.