Cape Town gets most of its rain in three months, and almost none for the other nine. Understanding cape town rainfall by month is the same as understanding why the dams fill when they do, and why a bad June can keep the city anxious until the following autumn.
May 2026. The 7-day catchment forecast shows 128 mm of rain expected across the mountains that feed Cape Town’s six dams. Long-term climatology for the same week: just under 7 mm. Cape Town is a city that waits eleven months for its rain and then gets it all at once.
That is unusual even by Cape Town standards, but it is not unusual in direction. Every year, the city’s Mediterranean winter weather delivers the same pattern: cold fronts roll in off the South Atlantic between May and August, wringing rain from the mountain catchments above Franschhoek and Villiersdorp. The rest of the year is warm, dry, and optimistic.
The dams fill on that window, or they don’t.
Why Cape Town is a winter-rainfall city
Almost every other major South African city gets its rain in summer. Johannesburg, Durban, Pretoria — all see afternoon thunderstorms from October to February and dry winters. Cape Town is the exception. The winter rainfall region is confined to a small area in the south-west, and Cape Town sits squarely inside it.
The reason is the movement of a pressure belt. In winter, the South Atlantic high-pressure system shifts north, opening a corridor for cold fronts from the mid-latitudes to reach the Cape Peninsula. Those fronts bring moist onshore air, which the mountains intercept and wring out as rain. In summer, the high pressure sits over the Cape itself, blocking that corridor entirely.
The result is a lopsided calendar. Around 70 percent of the region’s annual rainfall falls between June and September. February, the driest month, typically sees less than 20 mm across the city. June, the wettest, averages roughly 85 to 130 mm depending on the station — the mountain slopes above Kirstenbosch and Constantia are considerably wetter than the city bowl or the Atlantic seaboard at Camps Bay.
Month by month: what to expect
November through April is dry season. Temperatures climb into the mid-to-upper 20s Celsius. Rain is rare and usually brief. Average monthly totals sit between 10 mm and 30 mm for most of the city, less in sheltered western suburbs. The dams draw down across these months as the city’s consumption rises with the heat and the population’s garden hoses.
May is the shoulder month. The first cold fronts arrive. Monthly rainfall picks up to around 45 to 70 mm, and the catchments start to see real inflows. Dam levels, which have been falling since October, typically plateau or tick up slightly.
June and July are when Cape Town earns its annual water. The city averages 85 to 130 mm per month in June and roughly the same, or slightly more, in July, though station readings vary. The mountain catchments above the dams, at elevations above 1,000 m, can receive two to three times those totals. A good June and July can add 10 to 15 percentage points to the combined dam system in a single season. A bad one is how 2015, 2016, and 2017 unfolded.
August is still useful, but the front frequency begins to ease. Average rainfall of around 70 to 90 mm for the city, with catchment inflows continuing. Most years, August is the last reliable month for dam recharge.
September and October see the rain retreat. Totals fall back toward 30 to 40 mm per month, and the dams are largely done filling for the year. Whatever level they reach in October is the buffer the city carries into summer.
What the mountain catchments actually see
The rainfall numbers above describe the city. The dams are not in the city.
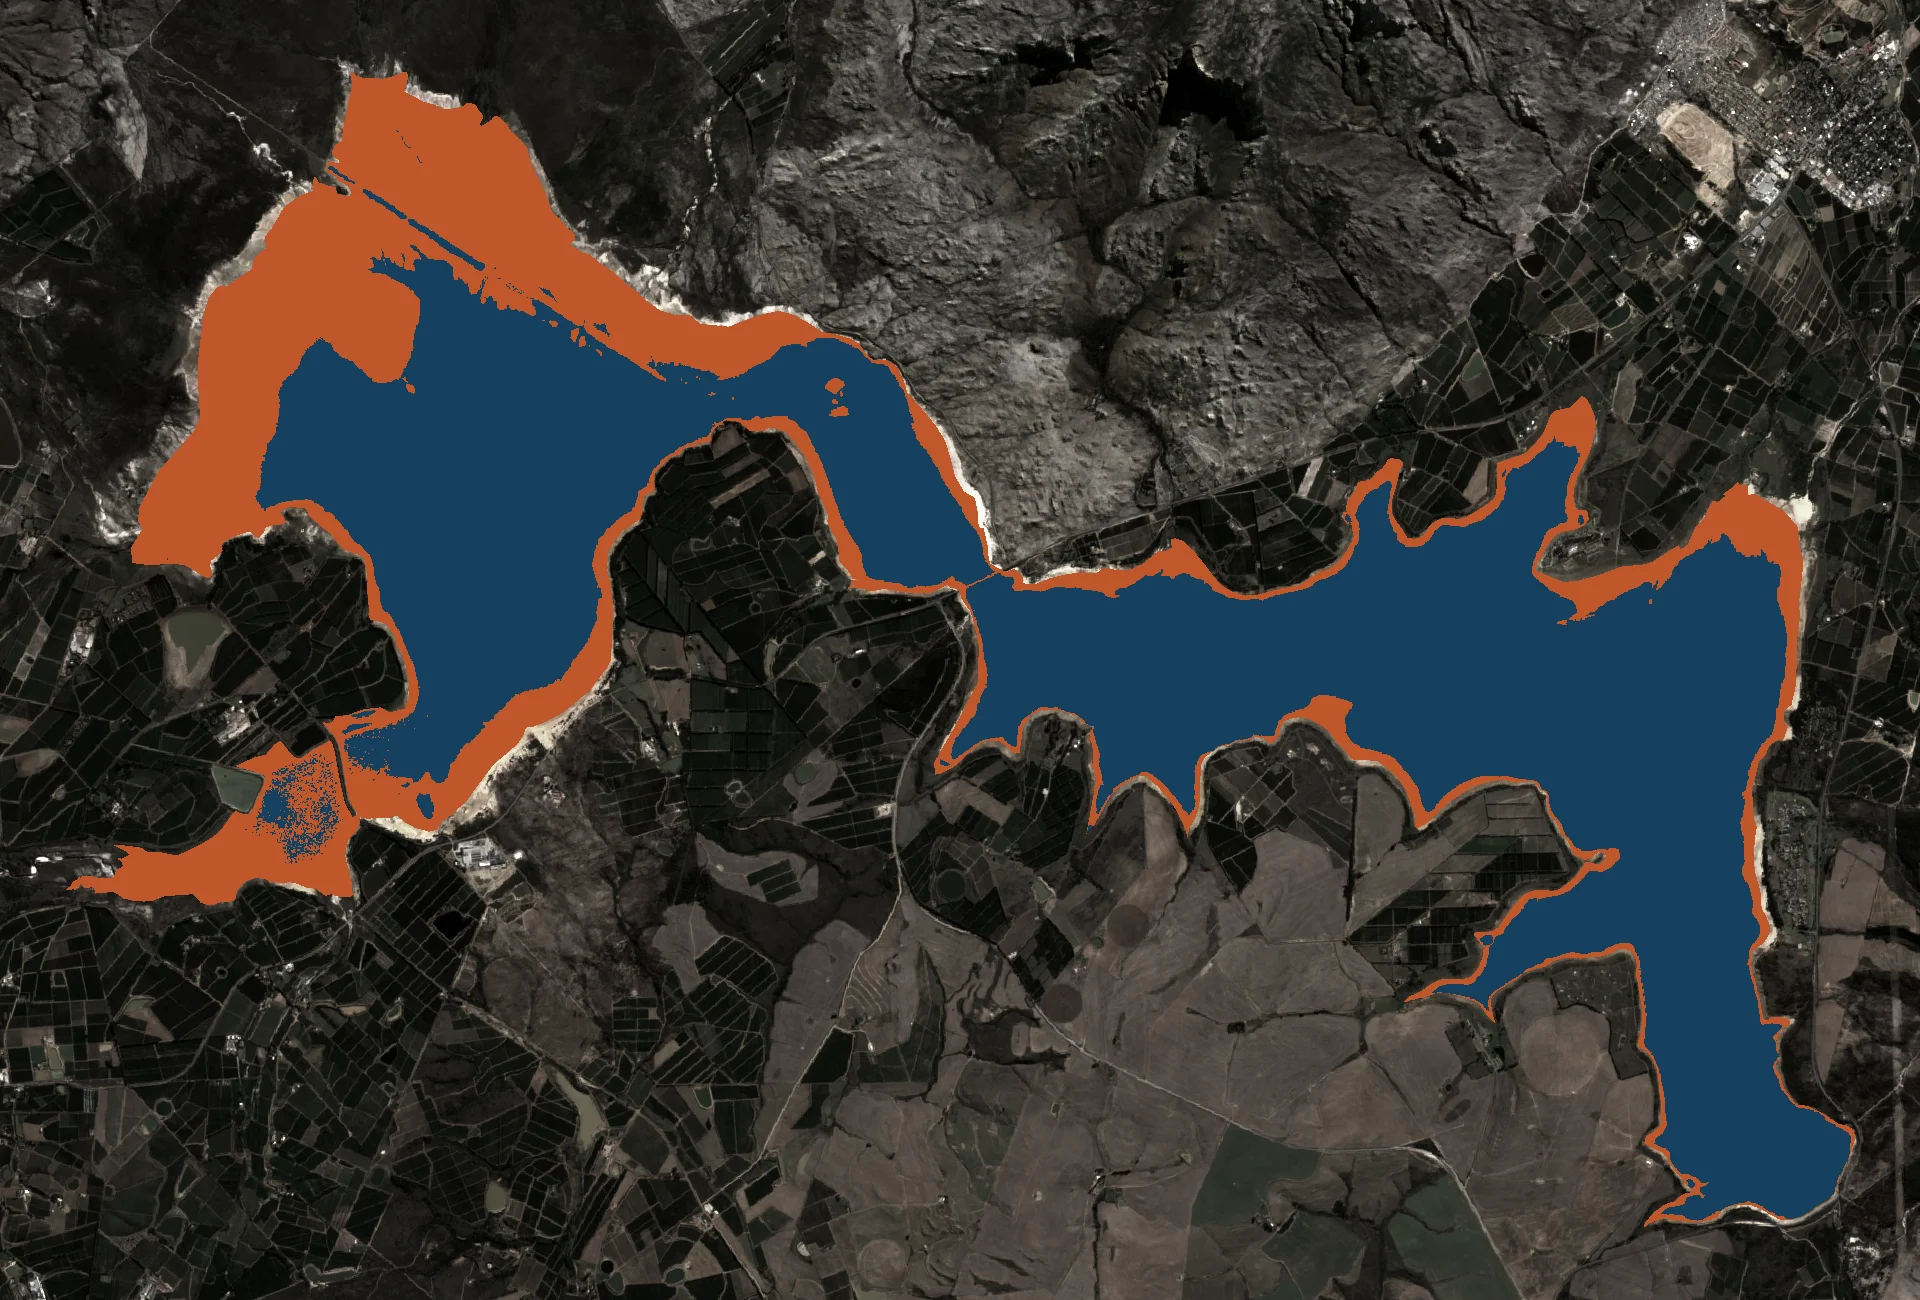
Theewaterskloof, the largest dam in the system, sits in the Sonderend River catchment near Villiersdorp, with the Hottentots Holland range among the terrain feeding it. The Berg River Dam, Wemmershoek, and Voëlvlei all draw from similar mountain terrain above Franschhoek and Paarl. These catchments receive annual totals of around 1,000 mm, roughly twice what the city bowl gets.
The mountains also experience rain differently. The eastern slopes above Kirstenbosch and Constantia receive more rain than the western slopes above Camps Bay, because the cold fronts that deliver Cape Town’s winter rainfall arrive from the north-west and push moisture-laden air upslope on the eastern and south-eastern flanks of the mountains. That orographic effect works on the dam catchments too: the higher and more exposed the terrain, the more rain it intercepts per cold front.
Which is why a forecast of 128 mm over the next seven days matters more than it might look: that rain is falling on catchment terrain, not a city street, and most of it will eventually run into the dams.
Three dry winters and what they cost
The 2015 to 2017 drought was not a single catastrophe. It was three consecutive Cape Town winters that failed to deliver.
The combined dam system entered May 2014 at 72 percent of capacity. Then three winters in a row — 2015, 2016, and 2017 — came in well below average. By the 2017 dry season’s end, combined storage had fallen to dangerously low levels. By early 2018, with Theewaterskloof holding around 13 percent of its own capacity, the City was drawing up contingency plans for Day Zero, the point at which the municipal taps would shut off entirely.
A 2019 study in npj Climate and Atmospheric Science found that the drought was driven by fewer winter rainfall days and lower rainfall intensity, both linked to the southward expansion of the Hadley circulation, a long-term shift that makes bad Cape Town winters more likely over the coming decades.
The lesson embedded in that history is simple. One bad winter is manageable. Two is difficult. Three depletes reserves the city cannot recover without a complete change in behaviour. The dams at 48.3 percent in May 2026, after a summer that drew them down from a wetter 2025, make the point: the cushion exists right now, but it only took one dry year to remove it.
Rainfall cape town today: how the 2026 season is shaping up
As of the week ending 4 May 2026, the combined dam system sits at 48.3 percent, up one percentage point from the week before and well below the 59.9 percent recorded at the same point in 2025. The city is consuming 149 litres per person per day, below the pre-drought high of around 200–220 litres but above the 2018 floor of roughly 50 litres under Level 6B restrictions.
The 7-day forecast, which draws from Open-Meteo weather model data for the dam catchment zones, shows around 128 mm of rain expected, about 18 times the long-term average for this week of the year. If that rain falls as forecast and the catchments are responsive, the dams could see a real jump by mid-May. Whether June and July then deliver in the same vein is the question the whole season hinges on.
Khayelitsha and Mitchells Plain households, which share a single connection between several families and have far less buffer against scarcity than the walled gardens of Constantia and Bishopscourt, watch this same forecast with less tolerance for error.
What dam levels in winter actually mean
Watching the combined dam level each Monday in June and July is the clearest signal of how the season is going. The weekly report from the City of Cape Town covers all six dams, Theewaterskloof, Voëlvlei, Berg River, Wemmershoek, Steenbras Upper, and Steenbras Lower, and the combined percentage is the number that matters most for supply planning.
A combined level above 60 percent entering October means the city is in good shape for the dry season. Below 40 percent and the City will likely begin talking about restrictions. Below 30 percent, the Day Zero predictor starts showing uncomfortable probability numbers.
For now, the city is in the opening weeks of the winter rainfall season that decides everything. The next 90 days are worth watching.