Cape Town draws its water from six dams scattered across the mountain ranges east and northeast of the city. Together they form the Western Cape Water Supply System, and their combined level is the single most-watched number in the city’s water calendar.
As of the week ending 6 July 2026, the six dams sat at a combined 77.3% — up from 74.9% the week before, and fractionally below the 78.1% recorded at the same point in 2025. Winter rain is doing its work, though a Western Cape Government reading on 7 July put the system at 75.9%, a slight lag from the DWS weekly report. The two sources use slightly different calculation windows, so a point or two of difference is normal.
The system’s total storage capacity is 898,221 megalitres. A megalitre is a million litres, and Cape Town currently draws roughly 874 megalitres a day from the network. At that rate, a full system would last just under three years — but a full system is a thought experiment. The dams never get that far before summer draws them down again.
Six dams, one system
The Western Cape Water Supply System is not six independent reservoirs each supplying a different part of the city. It is a single interlocked network of tunnels, pipelines, and transfer canals that moves water between catchments and treatment works depending on where rain fell and where demand sits.
The six dams are Theewaterskloof, Voelvlei, Berg River, Wemmershoek, Steenbras Upper, and Steenbras Lower. The Department of Water and Sanitation publishes their individual levels every week. The City of Cape Town cross-checks with its own daily readings and publishes a combined percentage each Monday.
The combined percentage is the number that matters most. Because each dam has a different capacity, adding up raw percentages would distort the picture — a full Wemmershoek (59 Mm³) counts for much less than a half-full Theewaterskloof (480 Mm³). The weighted aggregate, total megalitres stored divided by total capacity, is what the city uses and what this site tracks.
Where each dam sits
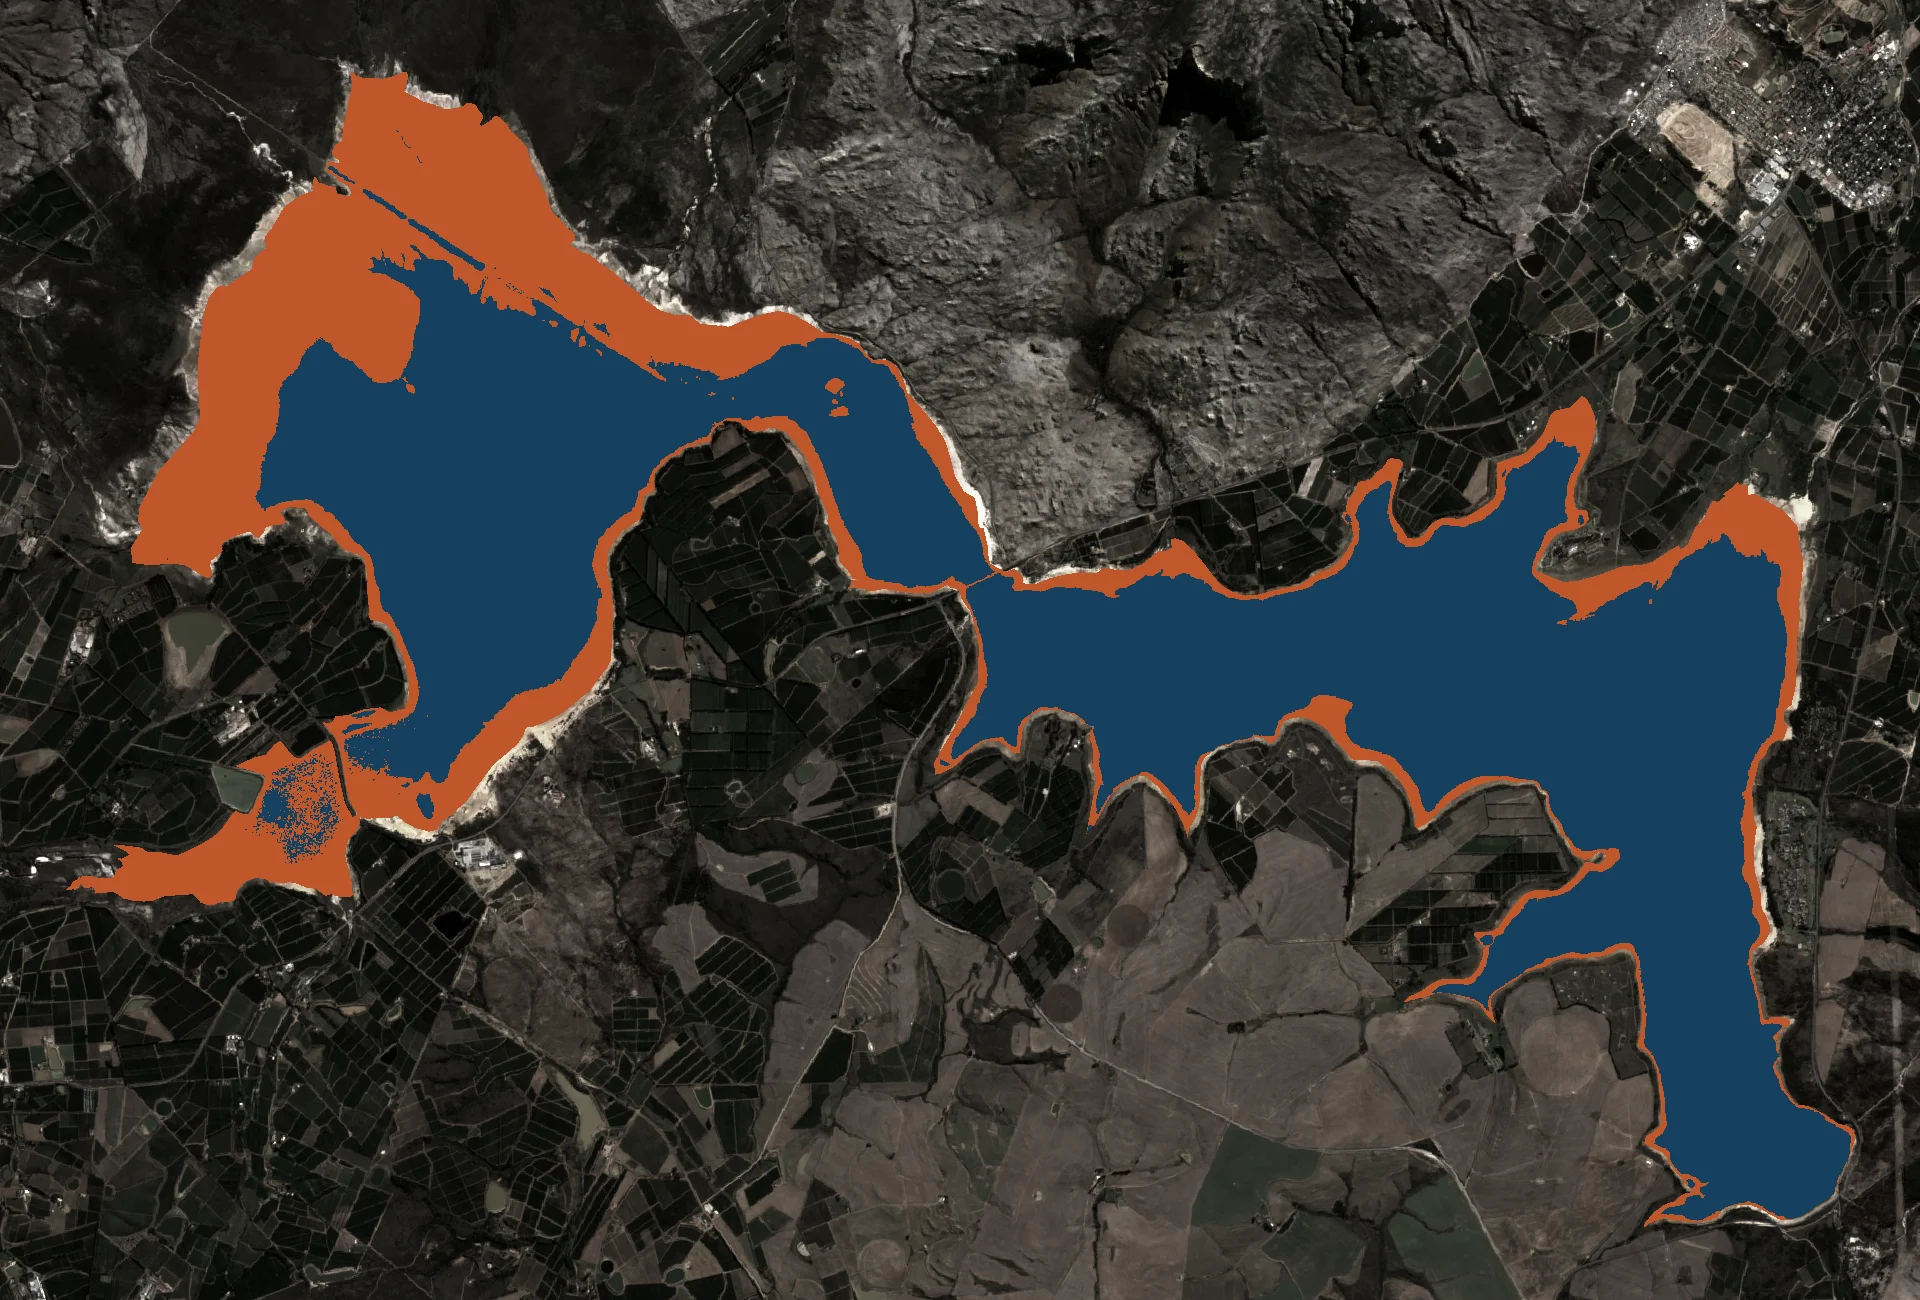
Theewaterskloof is the system’s anchor. Sitting in the Hottentots Holland Mountains near Villiersdorp, it holds about 480,000 megalitres at full capacity, just over half the system total on its own. Water crosses the range through a tunnel before reaching the city’s mains. As of early July 2026, it sits at 77% of capacity.
Voelvlei, near Gouda, holds 164,000 megalitres and was the workhorse before the Berg River Dam was built. It draws from the Voelvlei River and supplies towns in the Swartland as well as Cape Town. On 6 July 2026 it was at 60.8%, around 8 points below last year’s level for the same week.
Berg River Dam, between Franschhoek and Paarl, was the last major dam added to the system, completed in 2007 and inaugurated in 2009. Its 130,000 megalitres of storage was designed to capture winter high-flows in the Berg River and hold them through summer. As of July 2026 it sits at 89%.
Wemmershoek, fed by the Wemmershoek River in the Groot Drakenstein range, holds around 59,000 megalitres. It has no agricultural activity upstream, which keeps treatment costs low. It was at 99.9% at the start of July, effectively full.
The Steenbras pair sit in the Steenbras Mountains closest to Cape Town and feed the Strand and Somerset West area directly. Steenbras Upper (32,000 Ml) was at 98.6%, Steenbras Lower (34,000 Ml) at 54.2%.
How the numbers compare to history
The current 77.3% is comfortable. The 2017 floor for this same week in July was around 27%. The 2018 Day Zero crisis saw the system fall well below 21% at its lowest point in early 2018, before winter rain arrived and reversed the decline.
The post-drought years have been generous. Wemmershoek spent much of 2025 above 97%. Berg River ran near 100% through June 2025. The recovery since 2018 has held, and the City has kept average per-capita consumption at roughly 149 litres per person per day, well below the around 540 litres per person per day that was typical before the drought and restrictions took hold.
The 2025-to-2026 comparison shows a split picture. Theewaterskloof is 2 percentage points ahead of last year. Wemmershoek is 27 points ahead. Berg River, by contrast, is around 10 points behind. Individual dams diverge when rain falls unevenly across the catchments, which it almost always does.
What the combined level means for Cape Town
The 13.5% combined threshold is the number that concentrates the city’s attention. Below that floor, the bottom of each reservoir becomes too silt-heavy and shallow to draw cleanly. The Day Zero predictor uses 13.5% as its cut-off when modelling a thousand simulated winters against the Cape’s rainfall pattern.
At 77%, the system has about 694,000 megalitres in store.
Winter replenishment runs from May to August. By October the dams are typically at their annual peak. From November they start to fall, steadily, until the following May. A summer of above-average demand or below-average transfer can shift the end-of-summer low by 5 to 10 percentage points in either direction. That gap is where the anxiety lives.
Western Cape dam levels beyond the WCWSS
The six WCWSS dams cover Cape Town and the surrounding municipalities, Stellenbosch, Drakenstein, Swartland, and the Overberg. But the Western Cape has dozens of other dams serving towns from Clanwilliam to George.
The broader Western Cape dam network as of early July 2026 was also tracking well above recent drought-era lows. Brandvlei, the large dam serving Worcester and the Hex River Valley, and Clanwilliam Dam, which supplies irrigation in the Olifants River Valley, were among the broader provincial dams being tracked that week.
These dams don’t feed Cape Town’s taps directly, but they show how the broader Western Cape catchment is faring. A wet interior reduces competition for water across the province and eases political pressure on the WCWSS to serve agricultural users beyond its primary remit.
What to watch as winter deepens
Mid-July is around peak inflow season for most Western Cape catchments. The question for the next six weeks is whether the rain that has fallen on Theewaterskloof’s catchment in the Hottentots Holland range keeps building, and whether the below-normal July so far, the 7-day forecast shows just 0.8 mm against a climatological 37.7 mm, reverses in the second half of the month.
Voelvlei and Steenbras Lower are the two dams most in need of further inflow. Both are at levels that leave little cushion if the second half of winter is dry.
Watch the combined Cape Town dam levels each Monday for the weekly update. A system that enters October above 75% typically finishes summer above 40%, enough buffer to avoid restrictions in a normal year. The 2026 winter is far from over, and for now the dams are in decent shape.