Cape Town’s dams have just closed out the 2026 refill season sitting more than 15 percentage points below where they were this time last year, raising real questions about the city’s water shortage risk through a summer that could be drier than average.
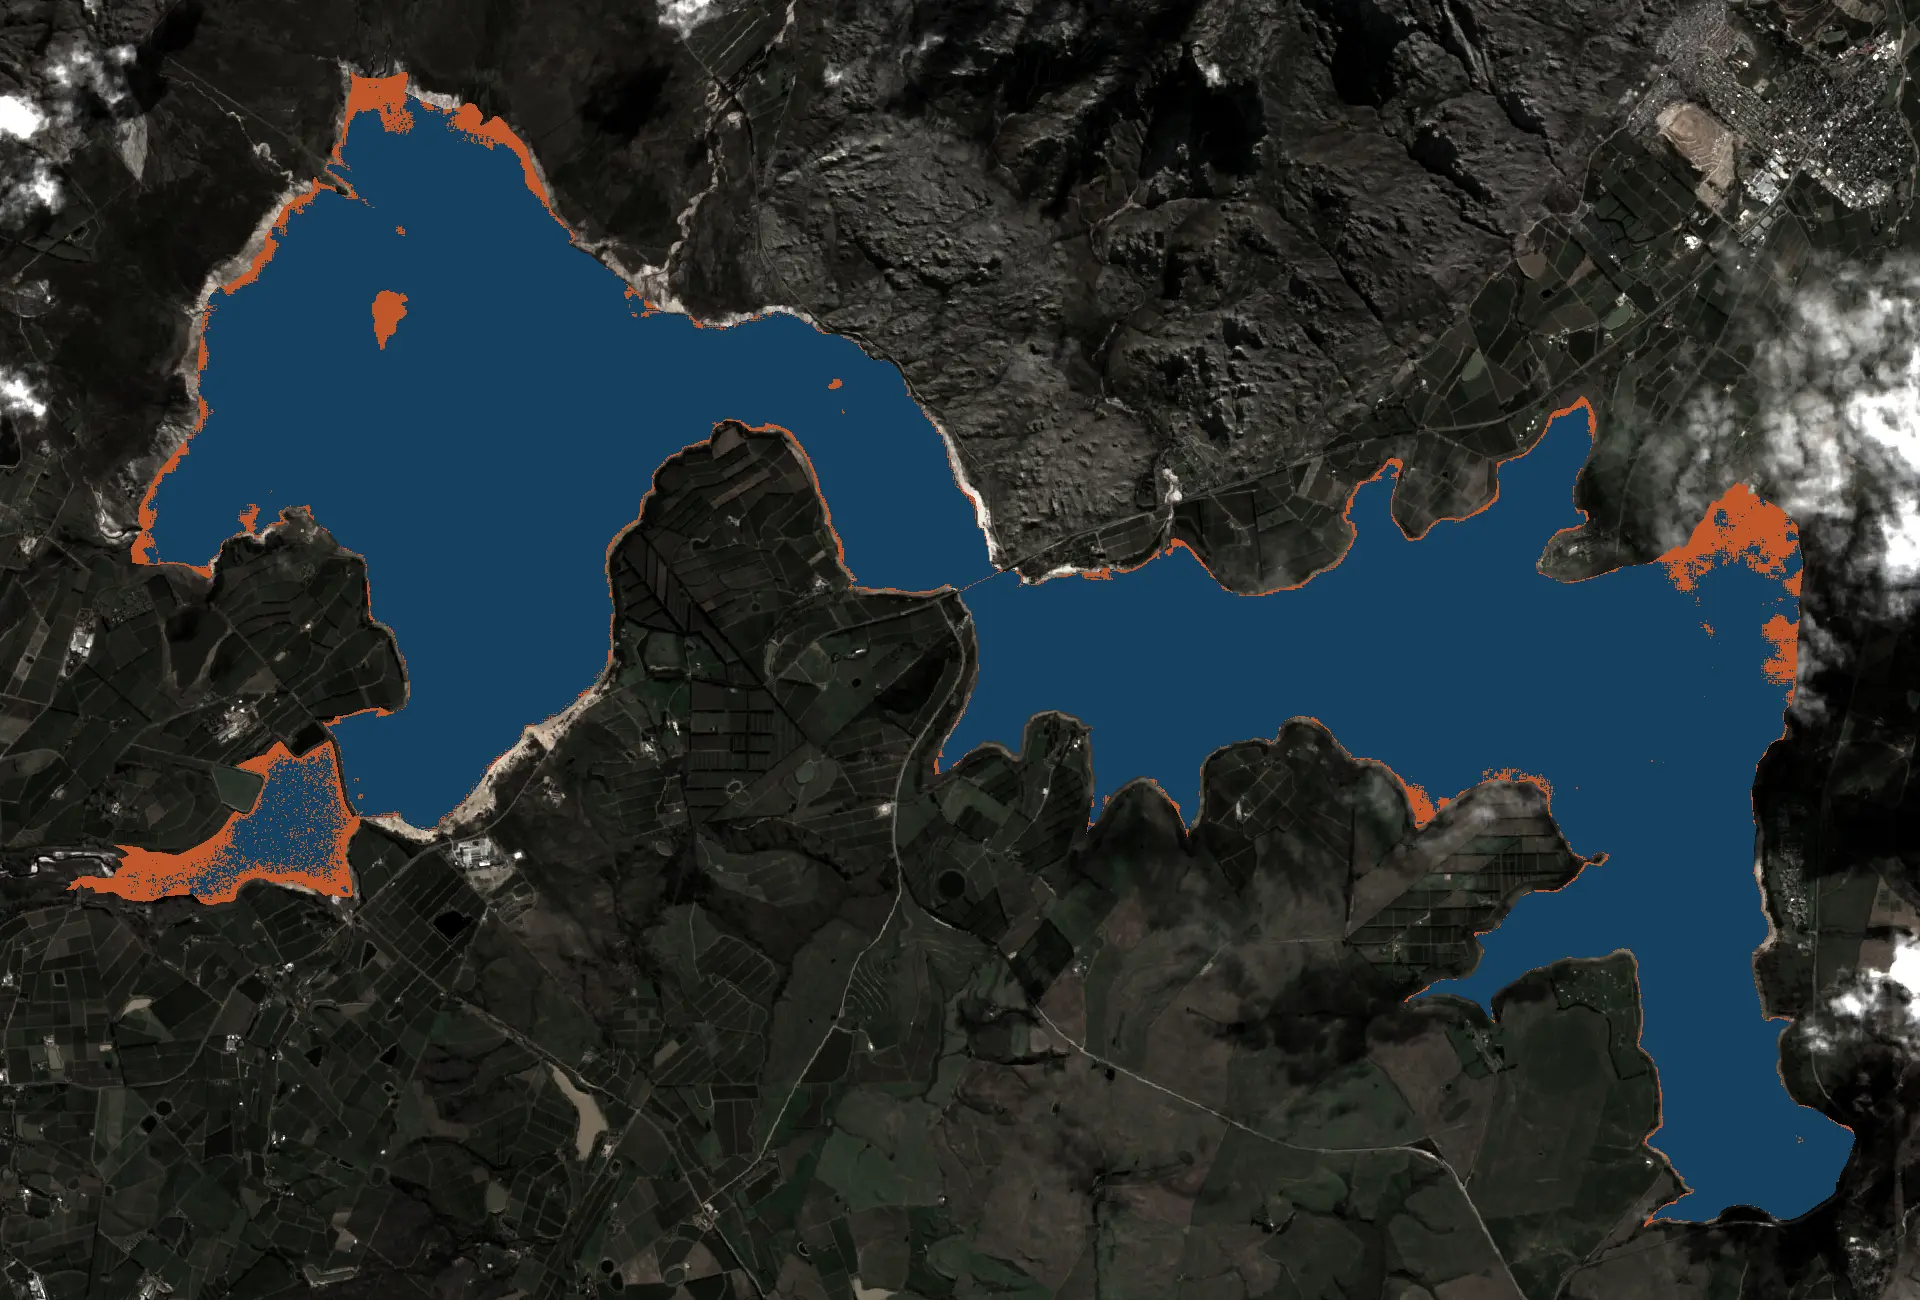
The week of 21 September 2026, the six-dam Western Cape Water Supply System stood at 76.6% of combined capacity. The same reading twelve months ago was 92.3%. That 15.7-percentage-point gap is what the city now carries into the dry season.
September is not a crisis. The dams are healthy in absolute terms. But the refill window, the roughly five months from May to September when Cape Town’s mountain catchments receive most of their rain, has just closed. Whatever is in the dams now is, broadly, what summer starts with. And summer here means evaporation, rising demand, and no meaningful rain until May.
The winter that did not deliver
July 2026 was the driest on record for many parts of the south-western Western Cape, with Cape Town International Airport recording just 14.4 mm of rain for the entire month, the lowest since 1958.
That is a long way from a normal Cape Town winter. The mountain catchments that feed Theewaterskloof and the five other dams in the system depend on cold fronts pushing in from the south-west between May and August. In a good year those fronts arrive reliably. This year they mostly did not.
The Winelands town of Paarl recorded 520 mm of total rainfall in 2026. Without torrential rain in May, when 190 mm fell in just three days during that month’s floods, the year would have produced only 330 mm. Paarl’s annual average sits around 820 mm.
The May flood event shows up in the data as a spike, a flash of inflow that pushed levels briefly higher before the dry months that followed drained them back. Theewaterskloof, which holds just over half the system’s total storage, finished the season at 76.8%.
What 76% going into summer actually means
The short answer: it is manageable, not comfortable.
The Day Zero threshold is 13.5%, the point at which the combined system drops too low for practical abstraction and the City would shift to emergency rationing. At 76.6%, the system is roughly 63 percentage points above that line. In Mm³ terms, the six dams hold hundreds of millions of cubic metres of usable water.
The longer answer is that the distance from “healthy” to “stressed” closes faster than it looks on paper, and it closes every year without rain. Between October and April, the catchments contribute almost nothing. The system runs entirely on what it holds. Pull at 871 megalitres a day, the current consumption rate, or 149 litres per person per day, and the numbers move quickly.
The weekly reading for around 31 August was approximately 76.3%, compared with around 92.5% during the same period in 2025. The trend has been consistent across the second half of winter: a gap that opened early and did not close.
The summer drawdown: how fast dams fall
From the end of September through to early May, the system loses roughly 1 to 2 percentage points a week in dry conditions. Inflow is minimal. Evaporation, highest in the summer months, comes off the top. Demand edges up as gardens need water and pools lose to the sun.
In a typical year the system might lose 30 to 40 percentage points between October and April, arriving at the start of the next May refill window somewhere in the 40s or 50s. Starting from 76.6% leaves a cushion. Starting 15 points lower than last year means arriving at the start of next winter’s refill season with less margin.
The live Day Zero predictor lets you run this arithmetic against historical rainfall patterns and see where the system lands under optimistic, average, and dry scenarios. The current starting point is the variable that matters most.
A drier spring and an El Niño signal
The South African Weather Service has warned that a very strong El Niño event is developing in the Pacific Ocean for the 2026/27 period, bringing warmer and drier than normal spring conditions to the province.
El Niño tends to suppress the frontal systems that carry rain into the Cape’s mountain catchments. The connection is not mechanical, the Western Cape is less directly coupled to El Niño than the east of the country, but the statistical tendency is clear: El Niño winters often mean below-average inflow, and El Niño summers often mean above-average heat and evaporation. The El Niño and Cape Town article goes into the detail on how the signal works.
The province is preparing for an El Niño-influenced summer, alongside higher temperatures, increased fire risk, and potential water stress.
This week’s seven-day rainfall forecast for the catchments is 4.3 mm, against a climatological expectation of 14.5 mm. The outlook editorial summary: “Dry week, then light rain returns.” Light rain at the end of a dry week, heading into a dry season, is not a recovery.
How demand changes what the numbers mean
The post-2018 story of Cape Town’s water system is mostly a demand story. Before the Day Zero crisis, the city used well over 200 litres per person per day. Today it runs at 149. That shift, carried by infrastructure investment, tariff signals, and a population that now watches dam levels the way other cities watch load-shedding schedules, is the main reason the 13.5% threshold has stayed theoretical.
At 149 litres per person per day, the drawdown curve looks very different from what it looked like in 2014 or 2015. The Cape Town water supply system runs tighter but lasts longer. Even so, the comparison with last year matters: in 2025, the system entered summer with nearly 92% in reserve. In 2026, it enters with 76.6%. That is 15 fewer percentage points of buffer to carry through seven months of dry weather.
The Western Cape province has set aside funds for water resilience measures this financial year, including groundwater extraction, reuse schemes, and demand management programmes. None of those close the gap in one season.
What to watch between now and May
Three numbers are worth tracking through summer.
The first is the combined system percentage, updated weekly by the City of Cape Town and visible on the homepage of this site. If the reading is dropping faster than two percentage points a week by December, something unusual is happening.
The second is whether the El Niño signal strengthens or weakens. The SA Weather Service seasonal outlooks are the authoritative source. A confirmed very strong El Niño by November would shift the probabilities materially for next winter’s inflow.
The third is consumption. At 149 litres per person per day, the city is running well below the pre-drought baseline. The Western Cape government has warned people to use water carefully as the province heads into what is expected to be a long, hot, and dry summer, with dam levels already below last year’s and El Niño expected to strengthen.
Watching the Western Cape Government’s dam levels page alongside the live combined reading here gives the clearest picture of where the system is heading. The dams are fine, for now. The question is whether 76.6% is the floor, or the start of a slide.