El Niño 2026 is strengthening in the Pacific while Cape Town’s dams sit near 75 percent after a violent, generous start to winter. The two facts are less connected than they look, and the rest of the season may not be as kind as the start.
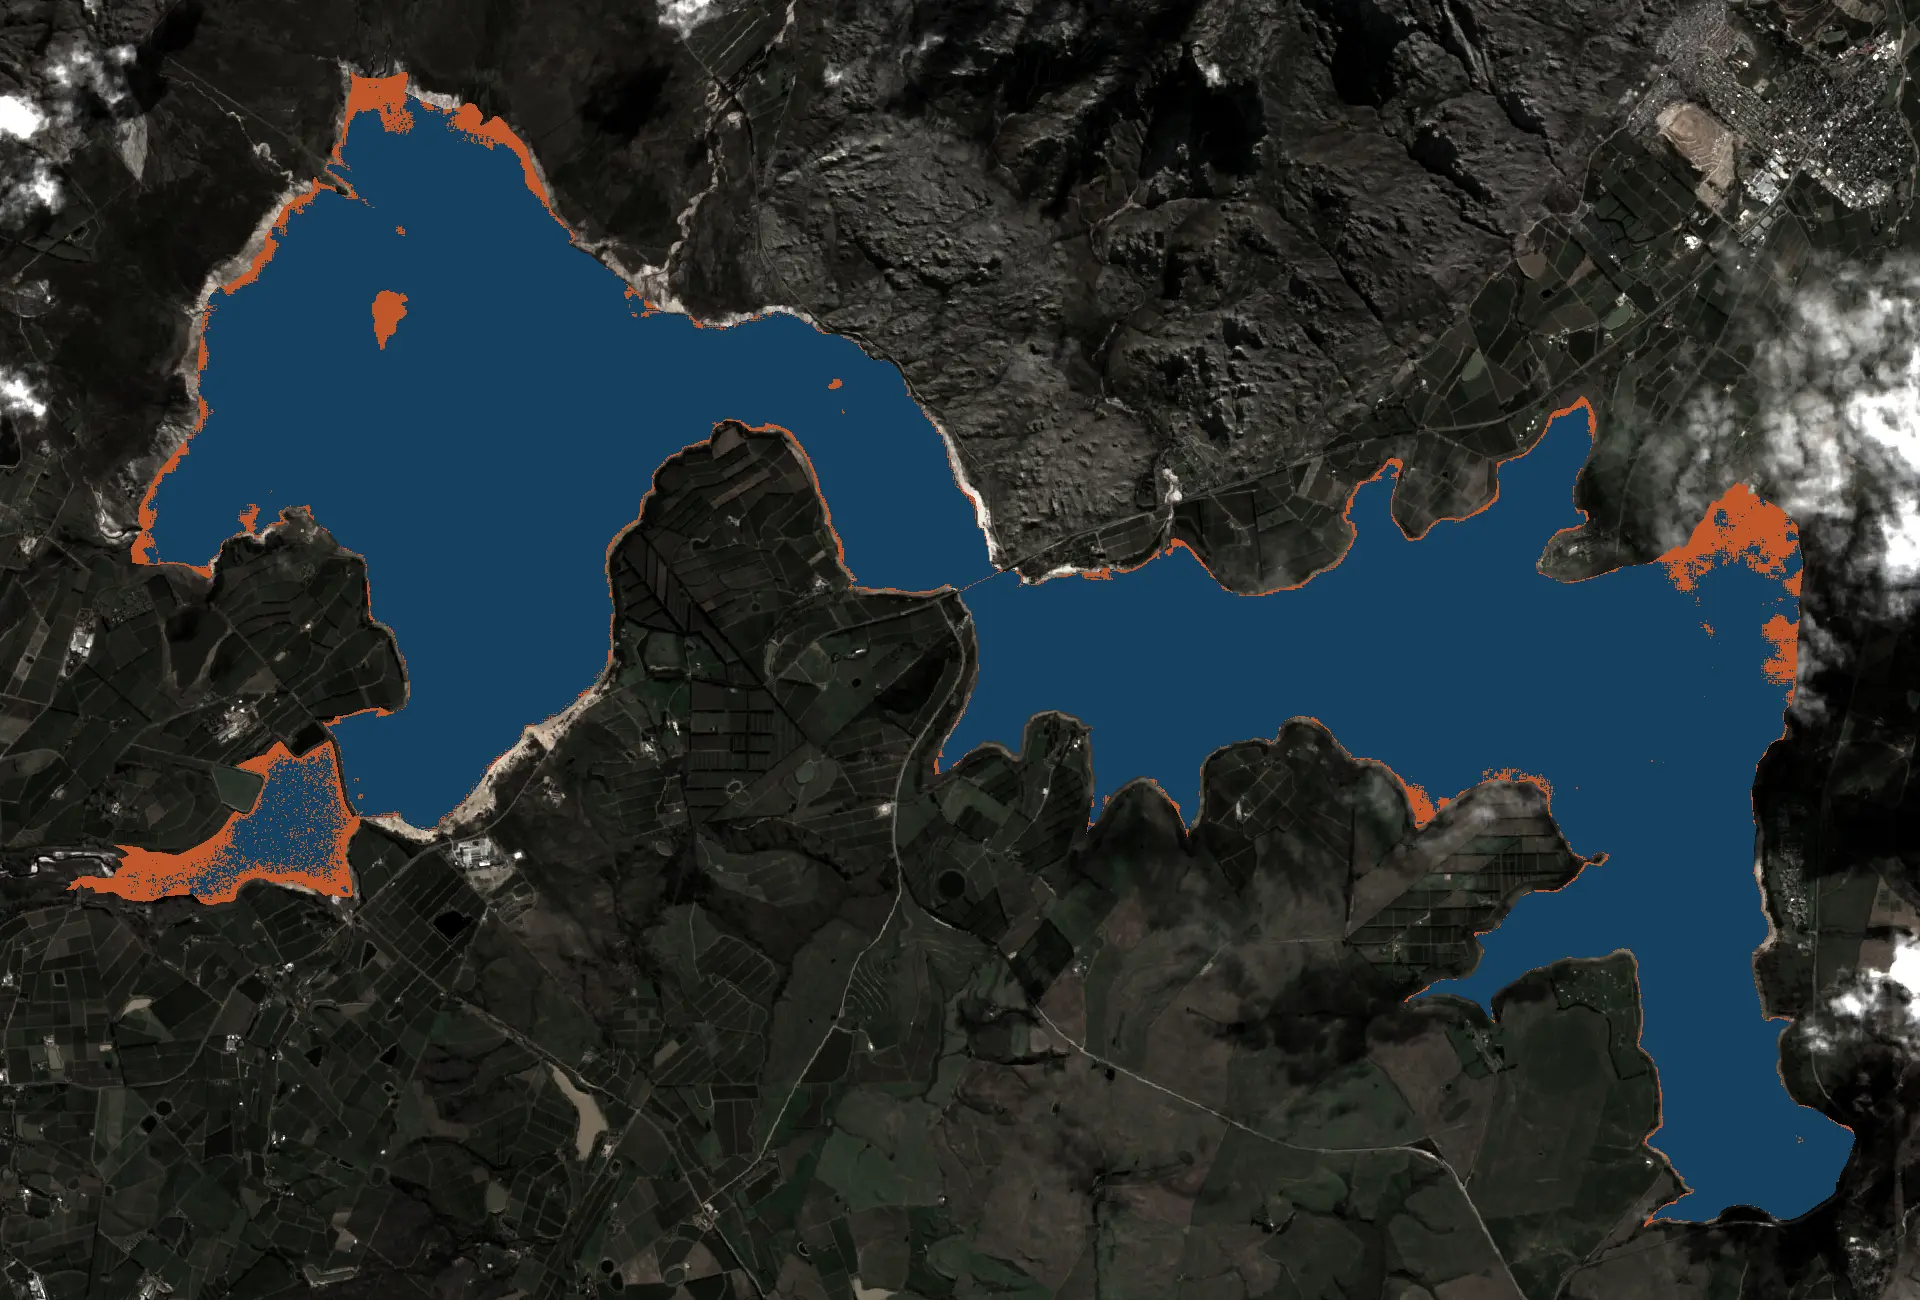
Between 4 and 18 May 2026, the combined storage of Cape Town’s six dams went from 47.9 to 69.4 percent. Twenty-one and a half percentage points in a fortnight. The system usually takes an entire winter to climb that far.
The winter of 2026 did not arrive so much as detonate. And because the same weeks brought news that an El Niño was forming in the Pacific, the two stories have been running together: the rain came with El Niño, so the rain will go when El Niño peaks.
The real picture is stranger, and worth getting right, because the second half of the story matters more than the first.
A winter that arrived all at once
The rain that filled the dams came from a chain of cold fronts and cut-off low-pressure systems that stalled over the province in the first half of May. Mountain catchments recorded rainfall of 150 to 200 mm across the wettest stretch. Officials described falls of a kind expected once in 20 to 200 years in several catchments, and EWN reported dam levels rising by nearly 20 percentage points in a single week.
It was not gentle weather. The same systems flooded rivers, closed roads and cost lives across the Western Cape. Filling a dam this fast is not a blessing arriving neatly; it is a flood with a useful by-product.
By the last week of June the system stood at 74.9 percent, against 73 percent on the same week last year. Theewaterskloof, the dam that holds just over half the system’s capacity, drove most of the climb.
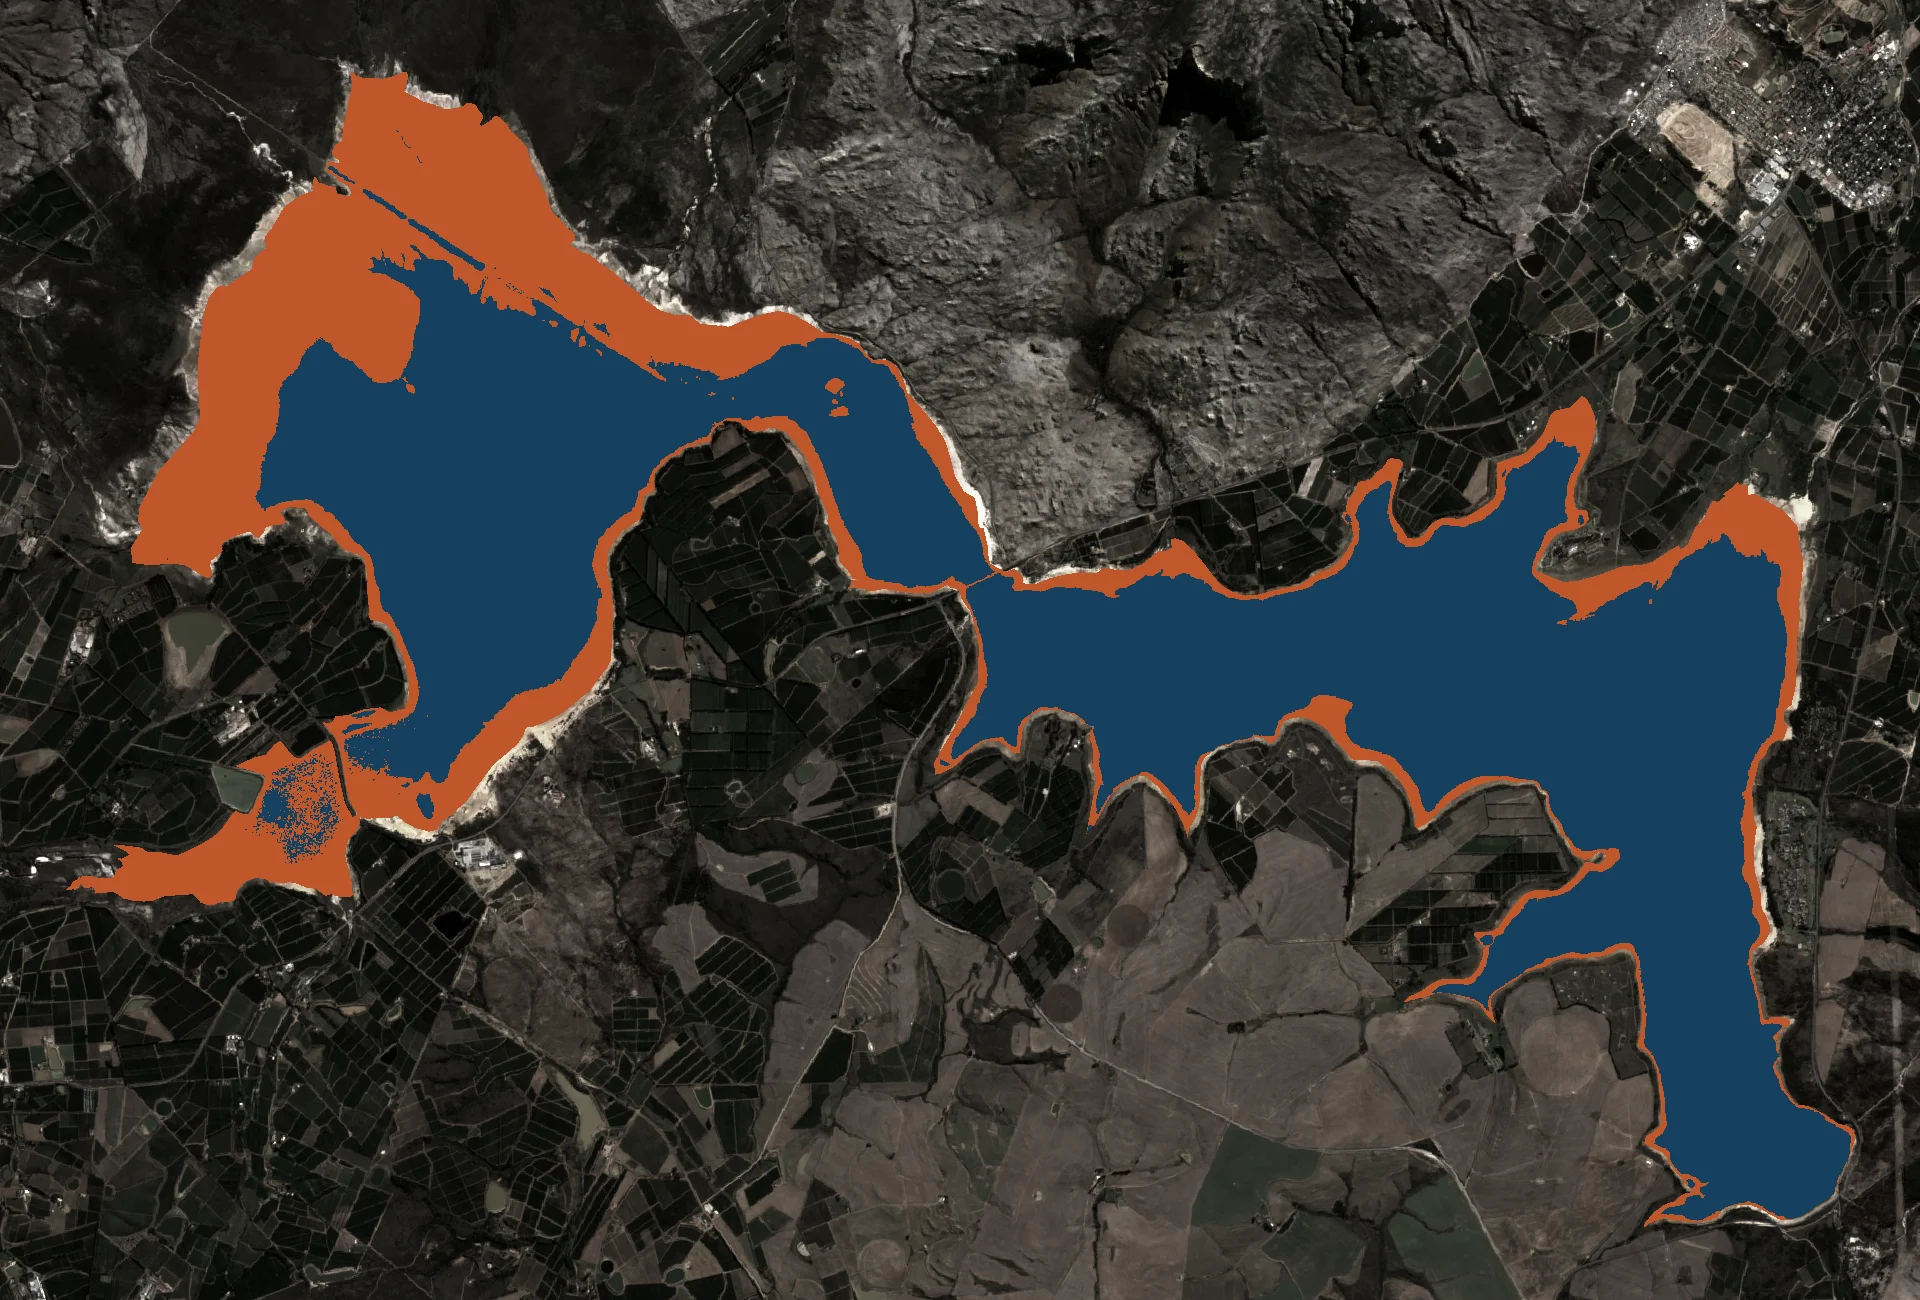
The April frame shows what the system looked like ten days before the first front: exposed shoreline, a dry autumn tail, storage lower than the same week in 2025.
Since mid-May, the tap has slowed
Look at the six weeks after the deluge and the shape changes. From 18 May to 29 June, combined storage moved from 69.4 to 74.9 percent. Five and a half points in six weeks, against twenty-one and a half in the fortnight before.
This week makes the point sharply. The seven-day forecast for the dam catchments totals about 4 mm of rain, against a ten-year early-July average near 35 mm. The homepage barometer tracks that forecast daily, and right now it reads dry in what should be the wettest month of the year.
One dry week in July is weather, not a verdict. But the contrast between the fortnight that delivered a winter’s worth of inflow and a July running at a tenth of its normal rain is the season’s actual story so far: a huge deposit, then quiet.
For the on-the-ground read of that quiet spell, the early flowering and the farmers already watching the summer, see Cape Town’s dry winter and El Niño.
What El Niño 2026 actually is
In June 2026 the US National Oceanic and Atmospheric Administration placed an El Niño Advisory in effect: sea-surface temperatures in the equatorial Pacific’s Niño 3.4 region ran about 1.7°C above the long-run average by mid-June, and most forecast models expect the event to strengthen through spring, with a real chance of a very strong event by September to November.
El Niño is the warm phase of a recurring Pacific temperature swing that redistributes rainfall around the planet. If the term is new to you, the El Niño and Cape Town explainer covers the mechanics; the short version is that a warm Pacific reshuffles the world’s storm patterns for a year or so.
Did the Pacific send the May storms?
No. The May rain came from cut-off lows spun out of the Southern Ocean storm track, the same machinery that has watered the Cape every winter for as long as records exist. That machinery answers to the position of the South Atlantic high and the westerly storm track, not to Pacific temperatures.
The historical numbers point the other way from the folk story. A 2012 study in the International Journal of Climatology by Philippon and colleagues, working from 682 rain gauges over five decades, found that since the late 1970s El Niño conditions have tilted the southwestern Cape’s May-to-July rainfall slightly wetter, not drier. If anything, a forming El Niño loads the early-winter dice a touch in Cape Town’s favour.
So “El Niño brought the rain” gets the season backwards twice: the storms were not Pacific weather, and the Pacific’s weak influence here runs wet, not dry.
The forecast for the rest of the season
The South African Weather Service’s June Seasonal Climate Watch, covering June to October, expects below-normal rainfall for the southwestern and southern coastal areas through winter and early spring, with above-normal temperatures across most of the country. Warmer air pulls harder on dams and soil; the service flagged rising water loss for exactly the regions that depend on winter storage.
A caution the 2026 season itself supplies: SAWS’s autumn outlook also leaned dry, and then May delivered the kind of rain that shows up once in decades. Seasonal forecasts deal in shifted odds, not certainties. The honest reading is that the second half of winter is more likely than not to run lean, and that nobody can promise it.
Where El Niño really bites: the summer after
Cape Town’s dams collect in winter and spend in summer, and it is the spending season where El Niño 2026 has form. Strong El Niño years lean hot and dry across South Africa’s summer-rainfall interior; the 2015-16 event cut the national maize crop by roughly a third and stressed water systems across the country. A very strong event peaking in spring would arrive just as the Cape’s dry season opens.
For the dams, a hotter summer means faster evaporation and thirstier gardens, which means the drawdown from whatever level winter leaves behind runs steeper. The Cape Town rainfall by month breakdown shows how little the city can expect from November to March: the water in the bank by October is, in effect, the budget for the year.
What 75 percent buys, and what it doesn’t
Seventy-five percent at the end of June is a strong position. It is not immunity. Combined storage entered May 2014 at 72 percent; three winters later it was at 21, and the city was publishing a countdown to Day Zero. The 13.5 percent shut-off threshold from those years is still the system’s working definition of failure, and the Day Zero predictor still runs a thousand simulated years against it.
The May storms bought Cape Town a comfortable winter. What they did not buy is next winter, or a cool summer, or a Pacific that behaves. The numbers to watch between now and October are simple: each month’s catchment rainfall against its long-run average, and whether storage crosses 80 percent before the rains shut off.
The dams are fuller than they have been at this point in any recent year, and El Niño 2026 is still gathering strength in the Pacific. The sky, for now, has gone quiet.